Download
1 / 11
110 likes | 251 Views
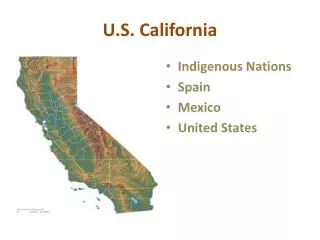
Energy in the U.S. and California. Introduction to GIS Vicky Hsu Fall 2012 Midterm. Policy Questions. How does the energy mix differ in the United States vs. California? What role do California state policies have in energy generation? What are the health and environmental implications?.

E N D
Energy in the U.S. and California Introduction to GIS Vicky Hsu Fall 2012 Midterm
Vicky Hsu - Fall 2012 Policy Questions • How does the energy mix differ in the United States vs. California? • What role do California state policies have in energy generation? • What are the health and environmental implications?
Vicky Hsu - Fall 2012 Types of Energy Sources • Non-Renewable Power Plants • Coal • Oil • Natural Gas • Renewable Power Plants • Hydroelectric • Solar • Wind • Nuclear • Geothermal
Vicky Hsu - Fall 2012 Non-Renewable Energy Sources-Nationwide Oil/Natural Gas Coal
Vicky Hsu - Fall 2012 Renewable Energy Sources-Nationwide Solar Hydroelectric Geothermal Nuclear Wind
Vicky Hsu - Fall 2012 CA State Policies • California is more progressive than rest of the country • 2007 • SB 1368 prevents utilities from signing long-term contracts with or investing in dirty coal plants • 2011 • AB 32 mandates 1/3 electrical power from renewables by 2020
Vicky Hsu - Fall 2012 California Power Plants
Vicky Hsu - Fall 2012 Terminology Watt: unit of power, energy per time Watt-hour: unit of energy Sources and Sinks in 2011-California Electricity Consumption Total: 272,645 GWh Total Power Plant Capacities: 64,175 MW These plants generated about 200,000 GWh. Assumption: Plants are running at 30-40% capacity full time. < GWh MW GWh MW GWh MW GWh MW GWh MW
Vicky Hsu - Fall 2012 Where is California getting its electricity? • “In 2011, California produced 70% of the electricity it uses; the rest was imported from the Pacific Northwest (10%) and the U.S. Southwest (20%). Natural gas is the main source for electricity generation at 45% of the total in-state electric generation system power.” Source: CA Energy Almanac
Vicky Hsu - Fall 2012 Air Quality Effects • Particulate Matter (PM) • 2.5 micrometers in diameter or smaller = PM2.5 • PM2.5 24-hr Standard (2006) = 35 micrograms/cubic meter averaged over 24-hr • Is the EPA PM2.5 24-hr Standard achieved in each county? • Do the counties near National Parks achieve the EPA PM2.5 Standard?
Vicky Hsu - Fall 2012 Thanks! Any questions? List of Skills Used KML to Layer Join Clip Graduated symbols Aggregate attribute field Merge Inset Map Sources: www.globalenergyobservatory.org EPA website CA Energy Commission website