Download

1 / 25
250 likes | 272 Views
Discover the remarkable growth of wind energy in the U.S., from market progress to future projections. Learn about the drivers behind wind energy expansion, including technological advances, cost competitiveness, and environmental considerations. Find out how wind energy contributes to economic development, energy security, and meeting the growing demand for electricity. Explore the importance of Renewable Portfolio Standards (RPSs) and the benefits of Production Tax Credits. Contact Ruth E. Leistensnider for more insights on the promising future of wind power!

E N D
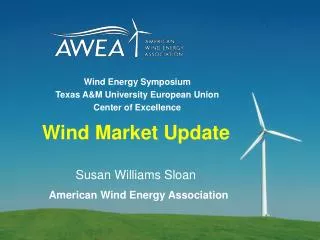
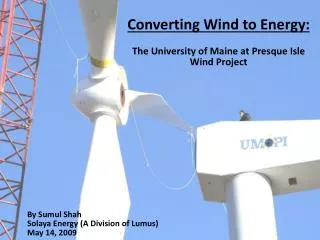
Energy in the U.S. - Why Wind? Financing Wind Power: The Future of Energy Institute for Professional and Executive Development Scottsdale, Arizona May 7, 2008
Overview • Market Progress • Market Drivers
Market Progress – Installed Wind Capacity U.S.: 1999 – 2,500 MW 2007 – 16,800 MW 5,244 MW installed in 2007 Source: NREL, AWEA, Global Wind Energy Council
Market Progress – Installed Wind Capacity Worldwide: 1999 – 13,600 MW 2007 – 94,123 MW 20,076 MW installed in 2007 Source: Global Wind Energy Council
Market Progress - $ 2007 Value of Global Wind Capacity additions: $37 Billion Source: Global Wind Energy Council
Market Progress – U.S. Projections • Projections vary: - Many consider 45,000 MW of installed capacity by 2015 to be realistic - Other estimates project up to 100,000 MW by 2015 • Dollar investment projected to range from $81 Billion to $180 Billion over that range
Drivers for Growth of Wind Capacity • Technology advances • Cost competitiveness • Fossil fuel cost increases • Environmental issues/climate change • Renewable Portfolio Standards (RPSs)
Drivers for Growth of Wind Capacity - 2 • Production tax credit • Economic development • Energy demand growth • Energy Security
Technology Advances • Larger wind turbines developed and proven 1995: 500 kW 2007: 2.5 - 3 MW • With larger turbines, greater efficiency - Improved materials - Improved gearboxes - Larger blades - Less overall land area needed to produce more MW
Technology Advances - 2 • Greater efficiency results in lower cost of generation 1990: average cost of 7.5 to 11 cents/kWh 2006: average cost of 4 to 6 cents/kWh for new capacity
Cost Competitiveness • Wind vs. other sources of generation ($/MWh) Coal 25 – 45 Natural gas 50 – 55 Oil 100 Solar 200 – 500 Wind 40 – 70 (depending on wind resource)
Cost Competitiveness • Natural gas prices doubled from 2000 - 2005
Environmental Considerations/Climate Change • No emissions from wind • Clean Air Act requirements tightly regulate emissions from fossil fuel-fired plants – S02, PM, NOx, Mercury • Climate change policies are developing, focusing on carbon emissions – Cal., RGGI, Kyoto Protocol • Wind uses no fossil fuel – therefore no impacts from fuel cycle • No water intake or discharge – at the same time that CWA requirements are tightening for fossil plants
RPSs • RPS is a policy which either requires or encourages that utilities supply a stated percentage of their power from renewable resources
States with RPSs Source: NREL
RPSs • 25 States and DC have RPSs in one form or another • Percentage goals vary from 2% (Iowa) to 40% (Maine) with varying target years • Some have fixed requirements, others are aspirational • Three states, Illinois, Virginia and Vermont, have non-binding goals • National RPS is under consideration in Congress
RPSs/Renewable Energy Credits • RPSs stimulate the development of markets for RECs • A REC is a credit equal to a unit of production of renewable energy (e.g., a MWh) • RECS may be used to satisfy RPS requirements, instead of actual generation
RPSs/Renewable Energy Credits - 2 • RECs have economic value that can approach the avoided cost of generation • Prices for RECS vary geographically, and there is not yet an active market in many areas - in some places, e.g., MA and CT, can be in the $40 – 50/MW range • REC sales can provide a revenue stream to support wind energy projects
Production Tax Credit • Federal income tax credit for production of energy by wind and other renewable resources • Currently 1.9 cents/kWh, for 10 years • Provides significant economic support for wind energy projects • Much more about PTC later • Short term renewals have produced stop/start development cycles
Economic Development • Revenue source for host communities • Revenue source for landowners, especially rural • Spin-off local revenues from construction • Construction jobs • A few good local jobs during operation
Energy Demand Growth • Electric energy demand in the US continues to increase • Most projections are for continued increase • New generation is needed to meet increased demand - although wind is not a base load resource, it contributes to meeting load
Energy Security • Foreign oil • Foreign policy Wind uses no oil
Why Wind? It’s the $, stupid
For more information contact: Ruth E. Leistensnider, Esq. Nixon Peabody LLP Omni Plaza Albany, New York 12207 518-427-2655 rleistensnider@nixonpeabody.com www.nixonpeabody.com