Download
1 / 15
150 likes | 171 Views
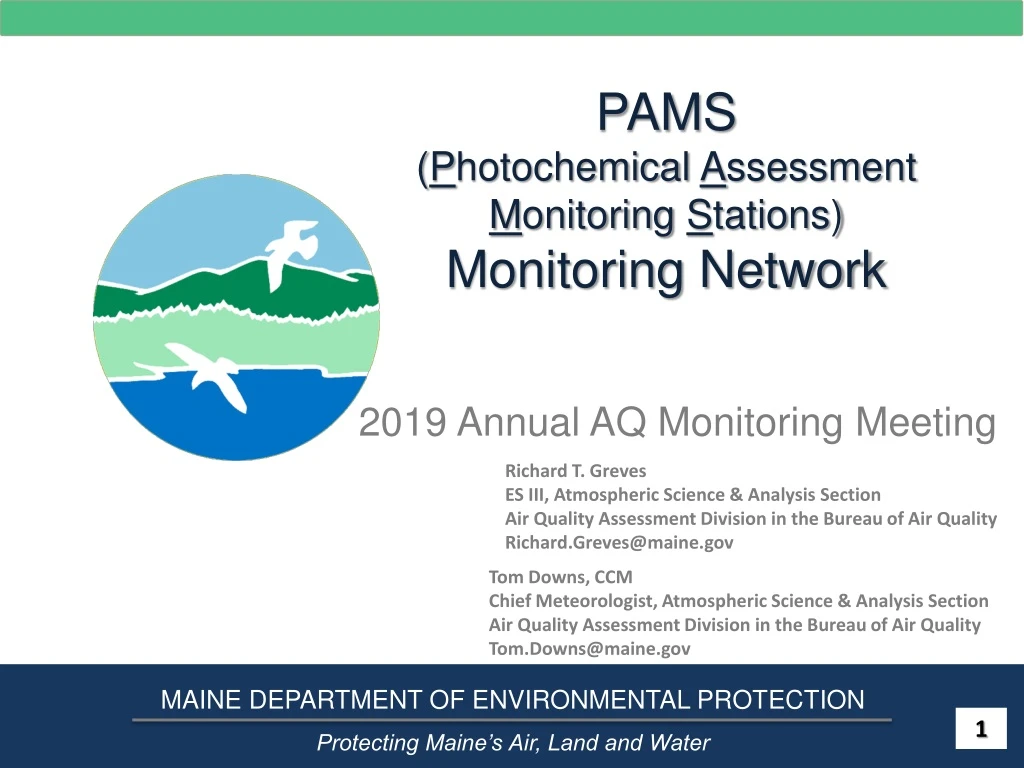
Join the PAMS Monitoring Network for the 2019 Annual Air Quality Monitoring Meeting led by Richard T. Greves and Tom Downs from the Maine Department of Environmental Protection. Learn about monitoring data across various time frames and VOC trends from 1997 to 2018. Connect with experts in atmospheric science and analysis to protect Maine's air quality.

E N D
PAMS (Photochemical Assessment Monitoring Stations)Monitoring Network 2019 Annual AQ Monitoring Meeting Richard T. Greves ES III, Atmospheric Science & Analysis Section Air Quality Assessment Division in the Bureau of Air Quality Richard.Greves@maine.gov Tom Downs, CCM Chief Meteorologist, Atmospheric Science & Analysis Section Air Quality Assessment Division in the Bureau of Air Quality Tom.Downs@maine.gov MAINE DEPARTMENT OF ENVIRONMENTAL PROTECTION Protecting Maine’s Air, Land and Water 1
1 hour 3 hour 24 hour Three different time-frames All Data is averaged to 24 hours MAINE DEPARTMENT OF ENVIRONMENTAL PROTECTION www.maine.gov/dep 2
One hour monitoring sites Site YEARS MAINE DEPARTMENT OF ENVIRONMENTAL PROTECTION www.maine.gov/dep 3
1997-2017 (aromatics not available 2003, 2005 and 2007 1997-2003, 2005-2014 and 2017 1997-2017 (some optional VOC's not available 14-17 1997-2018 1993-2018 2015-2018 1997-2018 1997-2017 2006-09, 2011-18 all alkenes available only for 2011, 2014 and 2017-18) Met Available 2013-18 4
Three hour monitoring sites MAINE DEPARTMENT OF ENVIRONMENTAL PROTECTION www.maine.gov/dep 6
24 hour monitoring sites MAINE DEPARTMENT OF ENVIRONMENTAL PROTECTION www.maine.gov/dep 8
August, 8, 2018 Maximum 8-hr Ozone = 70 ppb @ Cape Elizabeth 10x benzene/toluene < 4 – Fresh | > 4 – Aged Air Mass Morning (5-9 am) TNMOC/NOy >15 - NOx limited | >5 - VOC limited Hour (EST) 11
July 10, 2018 Maximum 8-hr Ozone = 81 ppb @ Pfizer (Bronx), NY (LISTOS region) Hour (EST) 12
OTC PAMS VOC TRENDS (June-August) Londonderry, NH Cape Elizabeth, ME Pfizer, NY Peterboro, NH Rutgers, NJ Essex, MD McMillian, DC 14
Richard T. Greves ES III, Atmospheric Science & Analysis Section Air Quality Assessment Division in the Bureau of Air Quality Richard.Greves@maine.gov Tom Downs, CCM Chief Meteorologist, Atmospheric Science & Analysis Section Air Quality Assessment Division in the Bureau of Air Quality Tom.Downs@maine.gov 15