Download
1 / 18
210 likes | 397 Views
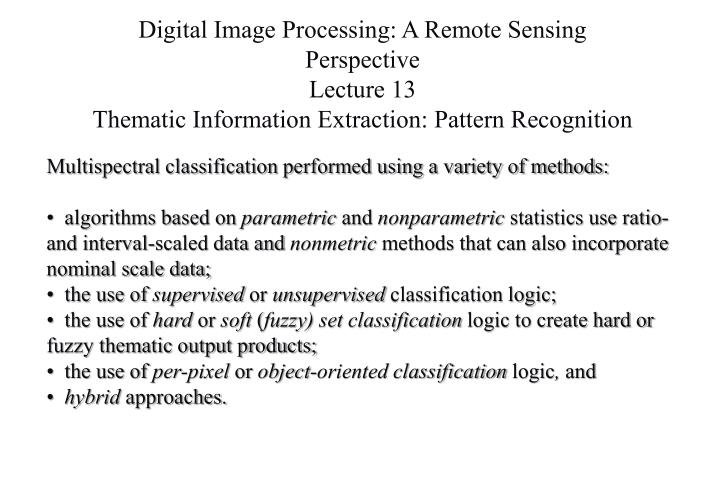
Digital Image Processing: A Remote Sensing Perspective Lecture 13 Thematic Information Extraction: Pattern Recognition. Multispectral classification performed using a variety of methods:

E N D
Digital Image Processing: A Remote Sensing Perspective Lecture 13 Thematic Information Extraction: Pattern Recognition • Multispectral classification performed using a variety of methods: • algorithms based on parametric and nonparametric statistics use ratio- and interval-scaled data and nonmetric methods that can also incorporate nominal scale data; • the use of supervised or unsupervised classification logic; • the use of hard or soft (fuzzy)setclassification logic to create hard or fuzzy thematic output products; • the use of per-pixel or object-oriented classification logic, and • hybrid approaches.
Parametric methods such as maximum likelihood classification and unsupervised clustering assume normally distributed remote sensor data and knowledge about the distribution of the underlying class density functions. Nonparametric methods such as nearest-neighbor classifiers, fuzzy classifiers, and neural networks may be applied to remote sensor data that are not normally distributed and without the assumption that the forms of the underlying densities are known. Nonmetric methods such as rule-based decision tree classifiers can operate on both real-valued data (e.g., reflectance values from 0 to 100%) and nominal scaled data (e.g., class 1 = forest; class 2 = agriculture).
Supervised vs. Unsupervised Classification Supervised classification Identity and location of some of the information classes are known a priori through a combination of fieldwork, interpretation of aerial photography, map analysis, and personal experience. Analyst locates specific sites in the remotely sensed data that represent homogeneous examples of these known information classes. These areas are commonly referred to as training sites because the spectral characteristics of these known areas are used to train the classification algorithm for mapping of the remainder of the image.
Multivariate and univariate statistical parameters (means, standard deviations, covariance matrices, correlation matrices, etc.) are calculated for each training site. Every pixel both within and outside the training sites is then evaluated and assigned to the class of which it has the highest likelihood.
Hard vs. Fuzzy Classification Supervised and unsupervised classification algorithms typically use hard classification logic to produce a classification map that consists of hard, discrete categories (e.g., forest, agriculture). Conversely, it is also possible to use fuzzy set classification logic, which takes into account the heterogeneous and imprecise nature of the real world.
Training Site Selection and Statistics Extraction Training sitesor sets are selected within the image that are representative of the information classes after the classification scheme is adopted. The training data will be valuable (useable) if the environment from which they were obtained is relatively homogeneous. Geographicsignature extension- distance (physical) which the training data may be used in the classification process. Many times is dependent on the homogeneity of information or spectral class. Geographical stratification- breaking the image into distinct units to facilitateselection and utility of the training sets
Once spatial and temporal signature extension factors have been considered, the analyst selects representative training sites for each class and collects the spectral statistics for each pixel found within each training site. • Size of training sites- The general rule is that if training data are being extracted from n bands then >10n pixels of training data are collected for each class. This is sufficient to compute the variance–covariance matrices required by some classification algorithms. Impact of small training sites due to geographic area. • There are a number of ways to collect the training site data, including: • collection of in situ information • on-screen selection of polygonal training data, and/or • on-screen seeding of training data.
The analyst may view the image and select polygonal areas of interest (AOI) representing spectral classes for each information class. Alternatively,the analyst may seed a specific location in the image. The seedprogram begins at a single x, y location and evaluates neighboring pixel values in all bands of interest. Using criteria specified by the analyst, the seed algorithm expands outward like an amoeba as long as it finds pixels with spectral characteristics similar to the original seed pixel. This is a very effective way of collecting homogeneous training information.
Each pixel in each training site associated with a particular class (c) is represented by a measurement vector, Xc: where BVi,j,k is the brightness value or digital number for the i,jth pixel in band k.
The brightness values or digital numbers for each pixel in each band in each training class can then be analyzed statistically to yield a mean measurement vector, Mc, for each class: where mck represents the mean value of the data obtained for classc in band k.
The raw measurement vector can also be analyzed to yield the covariance matrix for each class c: whereCovckl is the covariance of class c between bands k through l. For brevity, the notation for the covariance matrix for class c (i.e., Vckl) will be shortened to just Vc. The same will be true for the covariance matrix of class d (i.e., Vdkl = Vd).
Parallelepiped Classification Algorithm Widely used digital image classification decision rule based on simple Boolean “and/or” logic.Training data in n spectral bands are used to perform the classification. Brightness values from each pixel of the multispectral imagery are used to produce an n-dimensional mean vector, Mc = (mck, mc2, mc3, …, mcn) with mck being the mean value of the training data obtained for class c in band k out of m possible classes, as previously defined. sck is the standard deviation of the training data class c of band k out of m possible classes.
Using a one-standard deviation threshold (as shown in Figure 9-15), a parallelepiped algorithm decides BVijk is in class c if, and only if: • where • c = 1, 2, 3, …, m, number of classes, and • k = 1, 2, 3, …, n, number of bands. • Therefore, if the low and high decision boundaries are defined as: • and • the parallelepiped algorithm becomes
Minimum Distance to Means Classification Algorithm The minimum distance to means decision rule is computationally simple and commonly used. Used properly it can result in classification accuracy comparable to other more computationally intensive algorithms such as the maximum likelihood algorithm. Like the parallelepiped algorithm, it requires that the user provide the mean vectors for each class in each band µck from the training data. To perform a minimum distance classification, a program must calculate the distance to each mean vector µck from each unknown pixel (BVijk).
Maximum Likelihood Classification Algorithm • The aforementioned classifiers were based primarily on identifying decision boundaries in feature space based on training class multispectral distance measurements. The maximum likelihood decision rule is based on probability. • It assigns each pixel having pattern measurements or features X to the class i whose units are most probable or likely to have given rise to feature vector X. • In other words, the probability of a pixel belonging to each of a predefined set of m classes is calculated, and the pixel is then assigned to the class for which the probability is the highest.
Maximum Likelihood Classification Algorithm The maximum likelihood procedure assumes that the training data statistics for each class in each band are normally distributed (Gaussian). Training data with bi- or n-modal histograms in a single band are not ideal. In such cases the individual modes probably represent unique classes that should be trained upon individually and labeled as separate training classes. This should then produce unimodal, Gaussian training class statistics that fulfill the normal distribution requirement.