PAPER OUTLINE
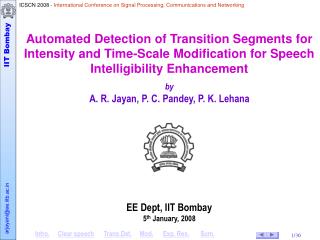
Automated Detection of Transition Segments for Intensity and Time-Scale Modification for Speech Intelligibility Enhancement by A. R. Jayan, P. C. Pandey, P. K. Lehana EE Dept, IIT Bombay 5 th January, 2008. PAPER OUTLINE. 1. Introduction 2. Acoustic Properties of Clear Speech

PAPER OUTLINE
E N D
Presentation Transcript
Automated Detection of Transition Segments for Intensity and Time-Scale Modification for Speech Intelligibility Enhancement by A. R. Jayan, P. C. Pandey, P. K. Lehana EE Dept, IIT Bombay 5th January, 2008
PAPER OUTLINE • 1. Introduction • 2. Acoustic Properties of Clear Speech • Automated Detection of Transition Segments • Intensity and Time-Scale Modification • 5. Experimental Results • 6. Summary and Conclusion
Intro. 1/2 INTRODUCTION Speech landmarks Regions in speech containing important information for speech perception Associated with spectral transitions Most of the landmarks coincide with phoneme boundaries • Landmarks types • 1. Abrupt-consonantal (AC) –Tight constrictions of primary articulators • 2. Abrupt (A) -Fast glottal or velum activity • 3. Non-abrupt (N) - Semi-vowel landmarks, less vocal tract constriction • 4. Vocalic (V) - Vowel landmarks, oral cavity maximally open, maximum energy, F1 • Abrupt (~68%) Vocalic (~29%) Non-abrupt (~3%)
Objective To improve speech intelligibility in quiet and noisy environments Automated detection of landmarks Speech modificationusingacoustic properties of clear speech Intro. 2/2 Landmarks
Clear speech 1/5 ACOUSTIC PROPERTIS OF CLEAR SPEECH • Clear speech: speech produced with clear articulation • when talking to a hearing impaired listener, or in noisy environments • Examples -http://www.acoustics.org/press/145th/clr-spch-tab.htm Conversational Clear ‘the book tells a story’ ‘the boy forgot his book’ Intelligibility of clear speech ▪ More intelligible for different classes of listeners & listening conditions ▪ Picheny et al. (1985): ~17% more intelligible than conversational speech
Clear speech 2/5 • Acoustic properties of clear speech • Picheny et al. (1986) • Sentence level • Reduced speaking rate (conv: 200 wpm, clr: 100 wpm) • Larger variation in fundamental frequency • Increased number of pauses, more pause durations • Word level • Less sound deletions • More sound insertions Phonetic level • Context dependent, non-linear increase in segment durations • More targeted vowel formants • Increase in consonant intensity
Clear speech 3/5 • Acoustic cues in clear speech are more robust and discriminable • Speech intelligibility of conversational speech can be improved by incorporating properties of clear speech • Consonant-vowel intensity ratio (CVR) enhancement • Increasing the ratio of rms energy of consonant segment to nearby vowel • Consonant duration enhancement • Increasing VOT, burst duration, formant transition duration • Difficulties • Detection of regions for modification • Performing modification with low signal processing artifacts
Clear speech 4/5 • Earlier studies on CVR enhancement • House et al. (1965): MRT, high scores for high consonant level • Gordon-Salant (1986): CVR +10dB, 19 CV, Elderly SNHI, +16% • Guelke (1987): Burst intensity +17 dB, stop CV, NH, +40% • Montgomery et al. (1987): CVR -20 dB to +9 dB, CVC, • NH, SNHI, no significant loudness increase • Freyman & Nerbonne (1989): Equated consonant levels across talkers, CV syllables, NH, +12% • Thomas & Pandey (1996): CVR +3 to +12 dB, CV & VC, NH, +16% • Kennedy et al. (1997): CE 0-24 dB, VC, SNHI, max CE: 8.3 dB (voiced), 10.7 dB (unvoiced) • Hazan & Simpson (1998): Burst +12 dB, fric. +6 dB, nas. +6 dB filtering, VCV, SUS, NH,+12%
Clear speech 5/5 • Earlier studies on duration enhancement • Gordon-Salant (1986): DUR +100%, marginal improvement • Thomas & Pandey (1996): BD +100%, FTD +50%, VOT +100% BD, FTD → improved scores, VOT → degraded • Vaughan et al. (2002): Unvoiced consonants expanded by1.2, 1.4 1.4 effective in noisy condition Nejime & Moore (1998): Voiced segments expanded by 1.2, 1.5 Degraded performance • Liu & Zeng (2006): Temporal envelope (2-50 Hz) contributes at positive SNRs • Fine structure (> 500 Hz) contributes at lower SNRs • Hodoshima et al. (2007): Slowed down, steady-state suppressed speech more intelligible in reverberant environments
Auto.Trans. 1/3 AUTOMATED DETECTION OF TRANSITION SEGMENTS • Identifying regions for enhancement - segmentation / landmark detection • Manual segmentation • accurate high detection rate • time consuming subjective • useful only for research & not for actual application • Automated detection of segments • low detection rate less accurate consistent • Segmentation based on Spectral Transition Measures • maximum spectral transitions coincide with segment boundaries
Auto.Trans. 2/3 • Earlier studies on automated segmentation • Mermelstien (1975): based on loudness variation, low detection rate, slow carefully uttered speech • Glass & Zue (1988): based on auditory critical bands, detection rate 90%, ± 20ms Sarkar & Sreenivas (2005): based on level crossing rate, adaptive level allocation, detection rate 78.6%, ± 20ms • Alani & Deriche (1999): wavelet transform based, energy in different bands,detection rate 90.9%, ± 20ms • Liu (1996): landmark detection algorithm, energy variation in spectral bands, detection rate 83%, ±20 ms
Auto.Trans. 3/3 • Earlier studies onautomated intelligibility enhancement • Colotte & Laprie (2000) • Segmentation by spectral variation function (82%) • Stops and unvoiced fricatives amplified by +4 dB • Time-scaled by 1.8, 2.0 (TD-PSOLA) • Missing word identification, TIMIT sentences • Improved performance • Skowronski & Harris (2006) • Spectral transition measure based voiced/unvoiced classification • Energy redistribution in voiced / unvoiced segments (ERVU) • Amplifying low energy temporal regions critical to intelligibility • Confusable words TI-46 corpus, 16 talkers, 25 subjects • Improved performance for 9 talkers, no degradation for others • Enhancement useful for native & non-native listeners
PROPOSED METHOD FOR INTELLIGIBILITY ENHANCEMENT Intel. Enh. 1/15 • VC and CV transition segments expanded, steady-state segments compressed, • overall speech duration kept unaltered • Intensity scaling of transition segments (CVR enhancement) • Objective: reducing the masking of consonantal segments by vowel segments
Intel. Enh. 2/15 Liu’s Landmark detection algorithm ▪ Based on energy variation in 6 spectral bands ▪ Segment duration, articulatory, and phonetic class constraints ▪ Glottal, sonorant closures, releases, stop closures, releases ▪ Peak picking based on convex-hull algorithm ▪ Matching of peaks across bands for locating boundaries ▪ Detection rate 83%, accuracy ±20ms Observations Assumptions in the method Spectral prominence represented by peak energy in the band One spectral prominence per band Information regarding frequency location of peak energy not used
Intel. Enh. 3/15 Landmark detection using spectral peaks and centroids Spectrum divided into five non-overlapping bands 0–0.4, 0.4–1.2, 1.2–2.0, 2.0–3.5, 3.5–5.0 kHz Spectral peak and centroid estimated in each band & used for calculating transition index • Peak energy • Centroid frequency • Rate-of-rise functions • Transition index
Intel. Enh. 4/15 Spectral peak & centroid variation in bands Example: /aka/ 0-0.4 kHz 0.4-1.2 kHz 1.2-2.0 kHz 2.0-3.5 kHz 3.5-5.0 kHz Centroid variation not necessarily in phase with energy variation Transitions: Some of energy peaks and centroids undergo change
Intel. Enh. 5/15 Peak & centroid ROR contours Example: /aba/ 0-0.4 kHz 0.4-1.2 kHz 1.2-2.0 kHz 2.0-3.5 kHz 3.5-5.0 kHz Observation: Product of two RORs near-to-zero during steady-states & peaks during transition segments
Intel. Enh. 6/15 Detection of transition segments /aba/ waveform spectrogram transition index boundaries (a) Signal waveform for VCV syllable /aka/ (b) Spectrogram, (c) Transition index (d) transition boundaries detected.
Intel. Enh. 7/15 Evaluation using sentences (a) (b) (c) sentence ‘put the butcher block table’, (b) TIMIT landmarks, and (c) detected landmarks. Manual annotation: “bcl”- /b/ closure onset, “b”- /b/ release burst, etc. Automatic detection: landmarks numbered as 5, 6,..etc.
Intel. Enh. 8/15 • Evaluation using sentences • 50 manually annotated sentences from TIMIT database • 5 speakers: 3 female, 2 male Detection rates ST-stop FR-fricative NAS-nasal V-vowel SV-semivowel
Intel. Enh. 9/15 • Harmonic plus noise model (HNM) (Stylianou 1996) • Harmonic part / Deterministic part (quasi periodic components of speech) • modeled by harmonics of fundamental frequency • Noise part /stochastic part (non periodic components) • modeled by LPC coefficients, energy envelope
Intel. Enh. 10/15 • HNM parameters • (Lehana and Pandey) Voiced / Unvoiced Classification (V/UV) • Harmonic part • pitch F0 • Maximum voiced frequency Fm • Amplitudes and phases of harmonics Ak • Noise part • LPC coefficients • Energy envelope Voiced Frame →parameters (Harmonic part + noise part ) Unvoiced Frame → parameters (noise part )
Intel. Enh. 11/15 HNM based analysis stage • Modification using a small parameter set • Low perceptual distortions, preserves naturalness and intelligibility HNM analysis stage
Intel. Enh. 12/15 HNM based time-scale modification stage Scaling factors
Intel. Enh. 13/15 Example: VCV syllable /aba/ Time scaling of consonant duration with steady-state compression
Intel. Enh. 14/15 Spectrograms: Time-scaled VCV syllable Orig. Steady-state compression Synth. β=1.5 Transition segment expansion β= 2 β=2.5 /ama/
Intel. Enh. 15/15 Time and Intensity scaling: VCV syllable Original Time-scaled Time-scaled Intensity enhanced +6dB /aba/
Exp. Res. 1/2 • EXPERIMENTAL RESULTS • Test material - VCV syllables /aba/, /ada/, /aga/, /apa/, /ata/, /aka/ • Time scaling factors : 1.0, 1.2, 1.5, 1.8, 2.0 • CVR enhancement : +6 dB • 12 processing conditions • Unprocessed: UP • Enhanced CVR without time-scaling: E • Time scaled: TS-1.0, TS-1.2, TS-1.5, TS-1.8, TS‑2.0 • Enhanced CVR , time scaled: ETS-1.0, ETS-1.2, ETS-1.5, ETS‑1.8, ETS-2.0 • Simulated hearing impairment (adding broadband noise) • 6 different SNR levels (inf, 0, -3, -6, -9, and -12 dB) • 72 test conditions • 60 presentations, 5 tests for each condition,1 subject
Exp. Res. 2/2 Results • Time-scaling factors 1.2-1.5 appears to be optimum • Time-scaling improves performance at lower SNR levels • Consonant intensity enhancement more effective
SUMMARY & CONCLUSION • Processing improved recognition scores for stop consonants • Without increasing overall speech duration • Method found more effective at lower SNR levels • Place feature identification improved significantly by processing • Intensity enhancement found more effective than duration enhancement • To be investigated • Optimum scaling factors for different speech material • Testing using different speech material • Testing on more number of subjects & subjects with • sensorineural impairment • Analysis in terms of vowel context, consonant category • Quantitative analysis of Intelligibility enhancement - MRT