Download
1 / 33
650 likes | 1.52k Views
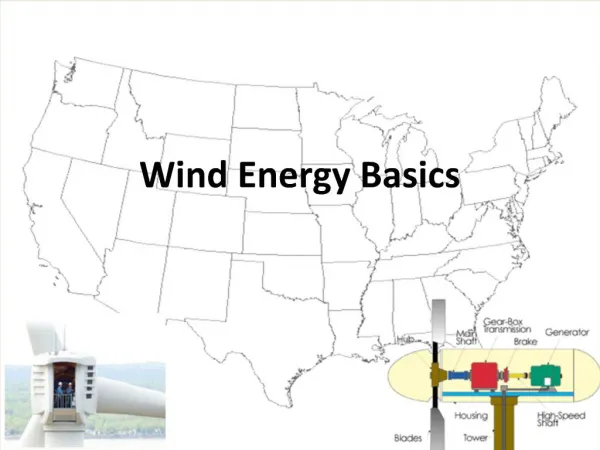
Wind Energy Basics. Outline. What is a wind plant? Power production Wind power equation Wind speed vs. height Usable speed range Problems with wind; potential solutions. 1. What is a wind plant? Overview. 1. What is a wind plant? Tower & Blades.

E N D
Outline What is a wind plant? Power production Wind power equation Wind speed vs. height Usable speed range Problems with wind; potential solutions
1. What is a wind plant? Overview
1. What is a wind plant? Electric Generator Type 1 Conventional Induction Generator (fixed speed) Type 2 Wound-rotor Induction Generator w/variable rotor resistance Type 3 Doubly-Fed Induction Generator (variable speed) Type 4 Full-converter interface Plant Feeders ac dc generator to to dc ac full power
1. What is a wind plant? Type 3 Doubly Fed Induction Generator • Most common technology today • Provides variable speed via rotor freq control • Converter rating only 1/3 of full power rating • Eliminates wind gust-induced power spikes • More efficient over wide wind speed • Provides voltage control
1. What is a wind plant? Collector Circuit • Distribution system, often 34.5
1. What is a wind plant? Offshore • About 600 GW available 5-50 mile range • About 50 GW available in <30m water • Installed cost ~$3000/MW; uncertain because US cont. shelf deeper than N. Sea
2. Power production Wind power equation Swept area At of turbine blades: • The disks have larger cross sectional area from left to right because • v1 > vt > v2 and • the mass flow rate must be the same everywhere within the streamtube. • Therefore, A 1 < At < A 2 v1 vt v2 v x
2. Power production Wind power equation 2. Air mass flowing: 1. Wind velocity: 3. Mass flow rate at swept area: 4b. Force on turbine blades: 4a. Kinetic energy change: 5b. Power extracted: 5a. Power extracted: 6b. Substitute (3) into (5b): 6a. Substitute (3) into (5a): 7. Equate 8. Substitute (7) into (6b): 9. Factor out v13:
2. Power production Wind power equation 10. Define wind stream speed ratio, a: This ratio is fixed for a given turbine & control condition. 11. Substitute a into power expression of (9): 12. Differentiate and find a which maximizes function: 13. Find the maximum power by substituting a=1/3 into (11):
2. Power production Wind power equation 14. Define Cp, the power (or performance) coefficient, which gives the ratio of the power extracted by the converter, P, to the power of the air stream, Pin. power extracted by the converter power of the air stream 15. The maximum value of Cp occurs when its numerator is maximum, i.e., when a=1/3: The Betz Limit!
2. Power production Cp vs. a
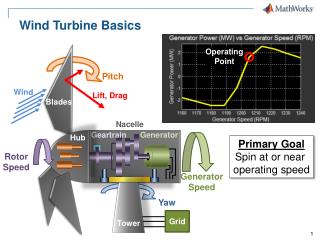
2. Power production Cp vs. λ and θ u: tangential velocity of blade tip Tip-speed ratio: ω: rotational velocity of blade R: rotor radius v1: wind speed Pitch: θ GE SLE 1.5 MW
2. Power production Cp vs. λ and θ u: tangential velocity of blade tip Tip-speed ratio: ω: rotational velocity of blade R: rotor radius v1: wind speed Pitch: θ GE SLE 1.5 MW
2. Power production Wind Power Equation • So power extracted depends on • Design factors: • Swept area, At • Environmental factors: • Air density, ρ (~1.225kg/m3 at sea level) • Wind speed v3 • 2. Control factors: • Tip speed ratio through the rotor speed ω • Pitch θ
2. Power production Control In Fig. a, a dotted curve is drawn through the points of maximum torque. This curve is very useful for control, in that we can be sure that as long as we are operating at a point on this curve, we are guaranteed to be operating the wind turbine at maximum efficiency. Therefore this curve, redrawn in Fig. b, dictates how the machine should be controlled in terms of torque and speed.
2. Power production Effects on wind speed: Location
2. Power production Effects on wind speed: Location
2. Power production Effects on wind speed: Height “In the daytime, when 10 m temperature is greater than at 80 m, the difference between the wind speeds is small due to solar irradiation, which heats the ground and causes buoyancy such that turbulent mixing leads to an effective coupling between the wind fields in the surface layer. During nighttime the temperature DIFFERENCE changes sign because of the cooling of the ground. This inversion dampens turbulent mixing and, hence, decouples the wind speed at different heights, leading to pronounced differences between wind speeds.” T80m < T10mGround heatingAir rise Turbulent mixingCoupling v80m ~ v10m Source: M. Lange and U. Focken, “Physical approach to Short-Term Wind Power Prediction,” Springer, 2005.
2. Power production Effects on wind speed: Height “The mean values of the wind speed show a pronounced dirunal cycle. At 10 m, the mean wind speed has a maximum at noon and a minimum around midnight. This behavior changes with increasing height, so that at 200 m, the dirunal cycle is inverse, with a broad minimum in daytime and maximum wind speeds at night. Hence, the better the coupling between the atmospheric layers during the day, the more horizontal momentum is transferred downwards from flow layers at large heights to those near the ground.” Nighttime peak occurs at 200 m. Almost flat at 80 m. Daytime peak occurs at 10 m. Average wind speed increases with height. Source: M. Lange and U. Focken, “Physical approach to Short-Term Wind Power Prediction,” Springer, 2005.
2. Power production Effects on wind speed: Height “The atmosphere is divided into several horizontal layers to separate different flow regimes. These layers are defined by the dominating physical effects that influence the dynamics. For wind energy use, the troposphere which spans the first five to ten km above the ground has to be considered as it contains the relevant wind field regimes.” Source: M. Lange and U. Focken, “Physical approach to Short-Term Wind Power Prediction,” Springer, 2005. Wind shear exponent differs locationally U: wind speed estimate at Hub Height Href is height at which reference data was taken Uref is wind speed at height of Href
2. Power production Effects on wind speed: Contours Wind profile at top of slope is fuller than that of approaching wind.
2. Power production Effects on wind speed: Roughness
2. Power production Usable speed range Cut-in speed (6.7 mph) Cut-out speed (55 mph)
3. Problems with wind; potential solutions Day-ahead forecast uncertainty • Fossil-generation is planned day-ahead • Fossil costs minimized if real time same as plan • Wind increases day-ahead forecast uncertainty • Solutions: • Pay increased fossil costs from fossil energy displaced by wind • Use fast ramping gen • Distribute wind gen widely • Improve forecasting • Smooth wind plant output • On-site regulation gen • Storage
3. Problems with wind; potential solutions Daily, annual wind peak not in phase w/load • Daily wind peaks may not coincide w/ load • Annual wind peaks occur in winter • Solutions: • “Spill” wind • Shift loads in time • Storage • Pumped storage • Pluggable hybrid vehicles • Batteries • H2, NH3 with fuel cell • Compressed air • …others Midwestern Region
3. Problems with wind; potential solutions Wind Power Movies JULY2006 JANUARY2006 Notice January has a lot more high-wind power than July. Also notice how the waves of wind power move through the entire EI.
3. Problems with wind; potential solutions Cost •$1050/kW capital cost • 34% capacity factor • 50-50 capital structure • 7% debt cost; 12.2% eqty rtrn • 20-year depreciation life • $25,000 annual O & M per MW 20-year levlzd cost=5¢/kWhr • Existing coal: <2.5¢/kWhr • Existing Nuclear: <3.0¢/kWhr • New gas combined cycle: >6.0¢/kWhr • New gas combustion turbine: >10¢/kWhr • Solution: • Cost of wind reduces with tower height • Tower designs, nacelle weight reduction, innovative constructn • Carbon cost makes wind good (best?) option
3. Problems with wind; potential solutions Wind is remote from load centers Transmission cost: a small fraction of total investment & operating costs. • …And it can pay for itself: • Assume $80B provides 20,000 MW delivery system over 30 years, 70% capacity factor, for Midwest wind energy to east coast. • This adds $21/MWh. • Cost of Midwest energy is $65/MWh. • Delivered cost of energy would then be $86/MWh. • East coast cost is $110/MWh.
Conclusions • High penetration levels require solution to cost, variability, and transmission. • Wind economics driven by wind speed, & thus by turbine height. • Solutions to variability and transmission problems could increase growth well beyond what is not being predicted. Source: European Wind Energy Association, “Wind Energy – The Facts,” Earthscan, 2009.