Download
1 / 22
230 likes | 445 Views
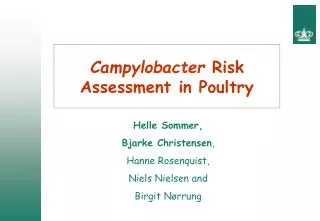
Campylobacter Risk Assessment in Poultry. Helle Sommer, Bjarke Christensen , Hanne Rosenquist, Niels Nielsen and Birgit Nørrung. Probability of Exposure. P farmh. P r e v a l e n s. SLAUGHTERHOUSE. RETAIL. CONSUMER. RISK. C a.bleeding. C o n c e n t r a t i o n.

E N D
Campylobacter Risk Assessment in Poultry Helle Sommer, Bjarke Christensen, Hanne Rosenquist, Niels Nielsen and Birgit Nørrung
Probability of Exposure Pfarmh. P r e v a l e n s SLAUGHTERHOUSE RETAIL CONSUMER RISK Ca.bleeding C o n c e n t r a t i o n Probability of Infection
Slaughter house modules • Data examinations – distributions • Process model building – explicit equations • Explicit equations/ simulations • Cross contamination • What-if-simulations
Data examinations • Data for 3 different purposes • - prevalence distribution -> slaughterhouse program • - concentration distribution • - model building, before and after a process • From mean values to a distribution • Lognormal/ normal –>illustrations • Same or different distributions –>variance analysis
From mean values to a distribution 17 log mean values from different flocks and from 2 different studies
From mean values to a distribution 17 distributions -> one common distribution
Log-normal or normal distribution ? ”True” data structure = simulated data (sim.=) Assumed distribution (dist.=) Published data = means of 4 samples,6 means from one study sim.= lognormal(6.9,2.3) dist.= normal or lognormal
Normal scale Real data set
Building mathematical models Slaughterhouseprocess
Explicit mathematical process model In normal scale μy= μx / Δμ 100 = 10000/100 In log scale μlogy = μlogx – Δμ 2 = 4 - 2
Explicit mathematical process model In normal scale μy = μx / Δμ 100 = 10000/100 In log scale μy = μx – Δμ 2 = 4 - 2 σy2 = β2 · σx2 Transformation line y = + β·x
Explicit mathematical process model Overall model μy = μx - Δμ σy2 = β2· σx2 Local model Y = + β·x Calculation of = (1-β)· μx- Δμ
Explicit mathematical process model In normal scale μy / μx = 158 In log scale μy = μx - 2.2
Explicit mathematical process model In normal scale y = x + z z Є N (μ, σ)
Summing up • Data + knowledge/logical assumptions of the process -> multiplicativ or additive process • Explicit equations for modelling slaughterhouse processes + Monte Carlo simulations, modelling each chicken with a given status of infection, concentration level, order in slaughtering, etc. • New data of concentration (input distribution) -> different or same distribution ? (mean and shape)
Advantage with explicit equations • Faster than simulations/Bootstrap/Jackknifing • Accounts for homogenization within flocks • More information along the slaughter line does not give rise to more uncertainty on the output distribution.