Download
1 / 36
370 likes | 517 Views
This report outlines the practical applications of Visual Sampling Plans (VSP) as utilized by the DOE Office of Legacy Management. It covers various analyses including temporal redundancy, trend analysis, and analyte correlation, helping to optimize environmental monitoring processes. Key methodologies like seasonal trend modeling, spatial analysis, and exogenous variables regression are discussed to enhance data interpretation and improve sampling efficiency. Real-world applications from UMTRCA and CERCLA sites demonstrate how these analytical tools contribute to effective contaminant management and regulatory compliance.

E N D
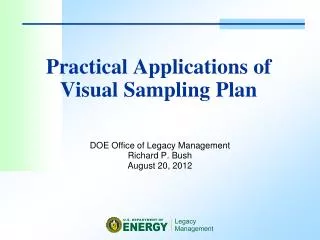
Practical Applications of Visual Sampling Plan DOE Office of Legacy ManagementRichard P. BushAugust 20, 2012
Visual Sample Plan (VSP) Modules with DOE-LM Relevance Temporal Redundancy Analysis: Evaluates data taken over time to determine whether the frequency of sampling may be reduced without losing important information. Trend Analysis: Evaluates data taken over time and fits linear and exponential decay functions. Projects how long it will take to achieve some acceptable level for the contaminant of concern. Calculates confidence and prediction intervals on the trend fits. Performs statistical tests that handle non-detect data. Seasonal trend modeling also. Trend Sampling Designs: Determines the number of samples and frequency of sampling required to detect a consequential upward or downward trend. Analyte Redundancy Analysis: Examines the correlation between analytes to determine if analytes that are less expensive to sample/analyze might be used as surrogates for more expensive/difficult analytes, thereby reducing the sampling/analytical frequency for some analytes. Spatial Analysis: Performs geostatistical analysis to produce concentration, uncertainty, and probability spatial maps using variogram models and kriging.
Visual Sample Plan (VSP) Modules with DOE-LM Relevance Spatial Redundancy Analysis: Identifies wells or spatially located samples that provide little spatial information content and may be considered for removal of service or sampling less frequently. Add Sample Locations: Identifies locations where additional sampling points or wells would reduce overall uncertainty by the greatest amount. Well Grouping Comparisons: Performs statistical comparisons between groups of wells including such groupings as upgradient vs. downgradient wells. RCRA Related Statistical Methods: Statistical comparisons of means against regulatory thresholds, means compared to background means, confidence intervals, sequential sampling approaches, MARSSIM methods, upper tolerance limits (UTLs), radiological transect survey design and analysis. Exogenous Variables Regression: Statistical modeling that accounts for or removes effects of exogenous variables (rainfall, water level, etc.) that can hide the effect of the constituent of interest over time.
Current Use of LM-Sponsored Modules in VSP • Trend analysis (for assessing remedy performance over time) • Analyte correlation analysis (for reducing the number of analytes) • Temporal redundancy analysis (for reducing the frequency of sampling)
Trend Analysis Statistics • Provides a quantitatively defensible way of demonstrating contaminant attenuation
Curve Fits to Concentration Data • Linear • Exponential
LM Trend Analysis Applications • Six UMTRCA sites (Colorado and Wyoming) • Three CERCLA sites (Fernald, OH; Monticello, UT; Weldon Spring, MO) • Provides: • Uniformly applied methods • Monitoring-specific graphical user interface • Statistical summaries • Report-quality graphics
Analyte Correlation Analysis (Identifying Indicator Parameters)
Correlation Analysis Applications • One UMTRCA site (Shiprock, New Mexico) • Provides: • Uniformly applied methods • Monitoring-specific user interface • Statistical summaries • Report-quality graphics
Can these wells be sampled every three years instead of annually without significant loss of information? Observation Well Temporal Redundancy
Methods for Assessing Temporal Redundancy • Geostatistical (variogram analysis of concentrations over time at an individual well) • Optimal sampling interval equals the correlation time (range of variogram) Concentrationsare correlated under 500 days
Correlation under 1,000 days Methods for Assessing Temporal Redundancy (2) • Geostatistical (variogram analysis for multiple wells) Composite Variogram
Methods for Assessing Temporal Redundancy (3) • Iterative thinning (captures complex seasonal effects) • Uses LOWESS curve fitting method (upper and lower confidence bands) • Tends to suggest a greater sampling frequency than variogram analysis
Temporal Redundancy Analysis Applications • One UMTRCA site (Shiprock, New Mexico) • Provides: • Uniformly applied methods • Monitoring-specific user interface • Statistical summaries • Report-quality graphics
Projected Uses of LM-Sponsored Modules in VSP • Reduction of spatial redundancy • Trends and statistics by well groups • Exogenous variables trend modeling (searching for geochemical influences on contaminant attenuation) • Probability and uncertainty maps
Do these two wells essentially measure the same concentration? Observation Well Spatial Redundancy
Base Map Spatial (Geostatistical) Analysis Exploratory Data Analysis (correlation of concentration over distance) Kriging (map of estimated concentrations)
Base Map Identifying Spatial Redundancy • Wells add limited plume information • Iterative process based on kriging weights Removed 10 Wells
Projected Use of RedundancyAnalysis Methods • Temporal Redundancy • Will likely apply to most LM groundwater sites • Can be prudently combined with use of indicator parameters • Spatial Redundancy • Previous winnowing of wells at most existing sites • Use should increase with addition of larger sites
Monitor Well Grouping 2,4-dinitrotoluene, Weldon Spring Chemical Plant
Why Analyze Groups of Wells? • Contaminant plumes frequently contain one or two recalcitrant wells • Two or more distinct plumes of the same contaminant can be subject to different attenuation processes (hydrologic, hydraulic, biogeochemical) • Statistical summaries of well groups formally quantify general contaminant behavior between sampling events
Group1 Group2 Group3 Bar Graphs of Group Results
Group1 Group2 Group3 Box and Whisker Plots by Group
Exogenous Variables Modeling • Attempts to find what parameters beside time affect contaminant concentration • Helps fate-and-transport analysts identify geochemical influences on contaminant concentration
Probability (Concentration > MCL) Place wells to identify the plume edge Probability of Exceedance Maps
Conditional Variance Place wells in area of greatest uncertainty Probability of Exceedance Maps
Additional Modules Used by LM • Random Sampling - Identifying sampling locations for vegetation surveys and ground-truthing hyperspectral surveys • Outlier Identification • Distribution Testing – Shapiro-Wilkes test for normality or log-normality
Potential Additional Applications • Add Geospatial mapping methods including 3-D visualization of plume boundaries and how they change over time. • Add a multivariate (multi-constituent) outlier test. • Perform analysis of trend data to determine and flag if seasonality exists and should be accounted for. • Test for an abrupt but consistent change in the slope (not the same as an outlier test)
Potential Additional Applications • Test for trends or abrupt change when non-detects are present (special ways to handle non-detects). • Test for linear trend using parametric linear trend algorithms or least squares fits. • Test that all seasons have trends in the same direction at a given monitoring station. • Graphically depict distribution of slopes from the MK test. Also, devise method to depict whether higher slopes are early/late in data set. • Allow user to input a distribution of parameter values instead of a single parameter value in user dialog boxes.
Conclusions • Legacy Management use of VSP currently includes or will include: • Trend Analysis • Analyte Correlation • Temporal Redundancy Analysis • Spatial Redundancy Analysis • Statistical Analysis of Well Groups • Exogenous Variable Modeling • Probability and Uncertainty Maps • Sampling Design
Conclusions (2) • VSP provides: • Efficient, uniformly applied (LM-wide) methods • Multiple approaches to analyzing data • Monitoring-specific user interface • Statistically defensible (objective) arguments for documenting remediation performance and removing redundancies