Download
1 / 4
Download Presentation 
Metagenomic DNA Analysis from Environmental Sediment Samples
An Image/Link below is provided (as is) to download presentation
Download Policy: Content on the Website is provided to you AS IS for your information and personal use and may not be sold / licensed / shared on other websites without getting consent from its author.
Content is provided to you AS IS for your information and personal use only.
Download presentation by click this link.
While downloading, if for some reason you are not able to download a presentation, the publisher may have deleted the file from their server.
During download, if you can't get a presentation, the file might be deleted by the publisher.
E N D
Presentation Transcript
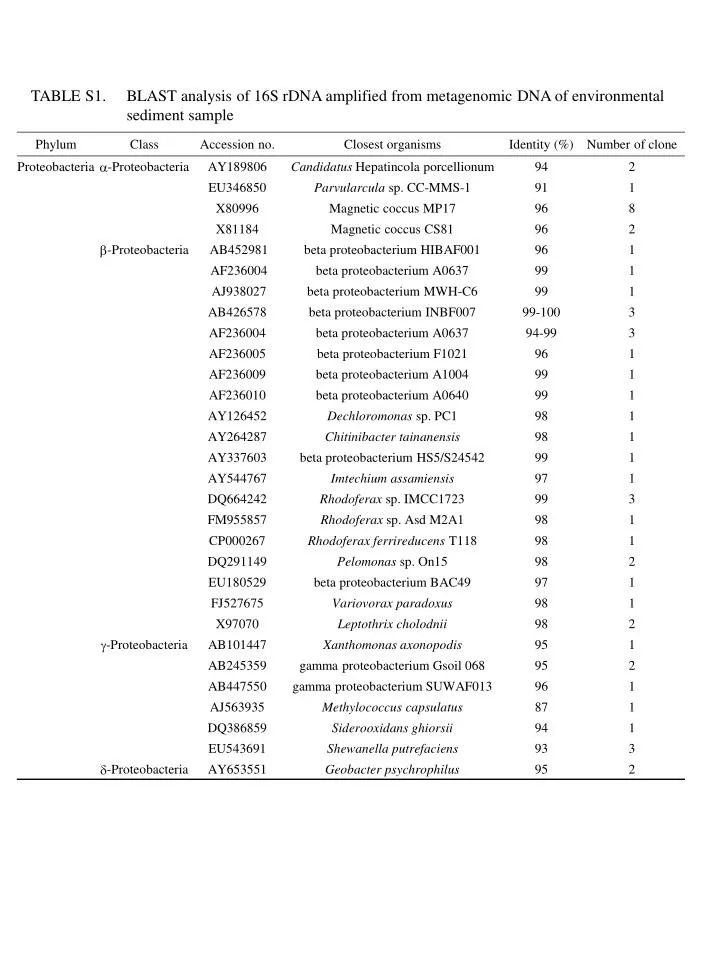
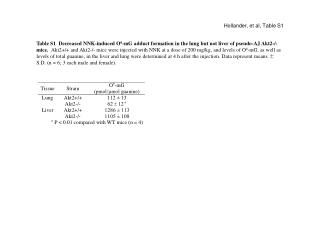
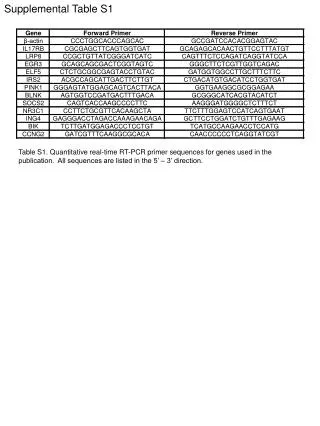
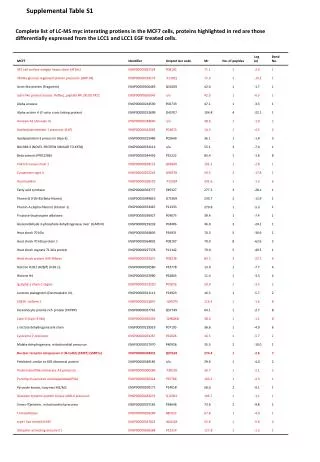
TABLE S1. BLAST analysis of 16S rDNA amplified from metagenomic DNA of environmental sediment sample
1 2 4 6 10 (mm) A B FS Log Count particles Cell G1 Noise SS Log Fluorescence intensity C Count particles G2 FS Log FIG. S1.
1 1 1 2 2 2 4 4 4 6 6 6 10 10 10 (mm) (mm) (mm) A B C Count particles Count particles Count particles FS Log FS Log FS Log FIG. S2.

More Related