Download
1 / 2
20 likes | 150 Views
Medical Management for Catastrophic Events. Nurse Time, Motion, and Physiologic Response Project. Hui Chen, Lei Shu, Jianying Zhang Jongwoo Song , William S. Cleveland Department of Statistics Purdue University. Mummoorthy Murugesan, Yang Wang Christopher W. Clifton

E N D
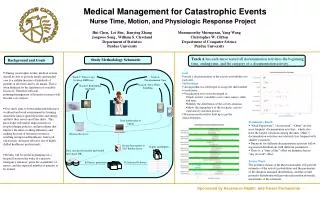
Medical Management for Catastrophic Events Nurse Time, Motion, and Physiologic Response Project Hui Chen, Lei Shu, Jianying Zhang Jongwoo Song , William S. Cleveland Department of Statistics Purdue University Mummoorthy Murugesan, Yang Wang Christopher W. Clifton Department of Computer Science Purdue University Track A has each nurse record all documentation activities-the beginning time, ending time, and the category of a documentation activity. Study Methodology Schematic Background and Goals • During catastrophic events, medical system should be able to provide timely and needed care to a sudden increase of hundreds of patients at all levels and by all means. This is often hindered by the limitation of available resources. Therefore efficient planning/management of hospital resources will become very critical. • Our study aims to better understand the nurse workload and work environment by learning about how nurses spend their time and energy, and how they travel on/off the shifts. This knowledge will enable improvements in hospital design, policies, and procedures that improve the nurse working efficiency and making best use of the nurse resources, resulting in improved healthcare, better job satisfaction, and more effective use of highly skilled healthcare professionals. • Results will be useful in planning out a hospital layout in the wake of a massive emergency situation, given the availability of nurses, and the expected number of patients to be treated. • Goal • Provide a characterization of the activity probabilities for each unit. • Methodology • An algorithm was developed to assign the shift number to each nurse. • Visualization tools were developed to: • Study activity variability across units, nurses, shifts and time. • Identify the distribution of the activity-duration. • Show the dependency of the stochastic activity-state/activity-duration process • Bayesian model will be built up to get the characterization . Track C: Nurses carry locating RFID tags Track A: Documentation Time Track B: Nurse Work Sampling. Track D: BodyMedia Armband. Data downloaded to laptop • Preliminary Result • “Meds Paperwork”, “Assessment”, “Other” are the most frequent documentation activities , which also have the largest variations among the units. Other 5 documentation activities are relatively less frequent with smaller variations. • Durations for different documentation activities follow log-normal distributions with different parameters. • There is a “time of day” effect on duration, but no “day of week” effect. • Future WorkThe posterior means of the Bayesian models will provide estimates of the activity probabilities and the parameters of the duration marginal distributions, and the overall posterior distribution will provide information about the uncertainty of the estimates. Wireless Receivers Secure data transfer to 24x7 Purdue Server Graphs and Reports Data: checked for Quality and loaded into Oracle DB R Objects generation R Statistical Software Sponsored by Ascension Health and Kaiser Permanente
Track Bhas each nurse carry a PDA that vibrates randomly during the day. When the PDA vibrates, the nurse enters the location and the activity category in the PDA. Track C uses Indoor Positioning System (IPS) to collect nurse motion data. Nurses carry four tracking tags (RFID) that report their locations and timestamps regularly. • Track Dhas volunteer nurses from any track wear the Bodymedia armband to measure the physical impact of workload and stress on the nurses. The Bodymedia armband measures the physiological variables, such as kilo calories burnt per minute, steps taken per minute, etc. • Goal • Provide a characterization of the activity parameters for each unit – the probabilities of the 76 activities and how they relate to the unit environmental variables. • Methodology • Visualization tools were developed to Study: • Activity variability across nurses, time, and units • Determine the exact form of the model • Model checking • Bayesian model with hierarchical priors will be built up to provide the characterization • Goal • Learn how nurses travel during their shifts, such as heavily traveled paths, transition probabilities, and total travel distance. • Learn how nurses spend their time at different locations, such as the nurse station and the patient room. • Learn about the relationship between nurse motion and travel distance and unit environmental variables such as the architectural layout • Goal • Evaluate and compare nurse working intensity and nurse motion intensity on/off the shift • Compare nurse’s working intensity and motion intensity among hospitals which could be related to hospital’s design. Methodology • Created plots for visualizing data and based on the plots, built statistical model. • Methodology • An algorithm was developed to determine the location and stay duration of a nurse by studying reports from the four RFID tags • Visualization tools (trellis display) were developed to display the large volume of spatial data and for data exploration. • Animation tools were used to show the movement of a nurse vividly. • Interesting Result • The travel distance during a specific nurse shift can vary from almost 0 km to 11km. (Some nurses walk really a lot!) • The walking speed which is measuring the motion intensity of nurse varies across hospitals, the hospital which has the smallest travel speed happens to be the circle design! • On average, the nurse’s heart rate beating per minute in their working duration is about 72~90. • On average, the nurses’ energy expenditure in one minute is about 1~3 kcal, but if look at the total energy spent on a shift, the maximum can be 2500kcal! • Preliminary Result • Nurses work in the Nurse Station and Patient Room most often, then on the unit and off the unit. • Direct Care, Indirect Care and Documentation are the most significant activity groups compared to Personal, Other, Waste, Administrative. • 60% of the nurses' activities are value added. 17% are non-value added. 23% are necessary. • Future Work • The posterior means of the Bayesian model will provide estimates of the activity probabilities and the overall posterior distribution will provide information about the uncertainty of the estimates. • Preliminary Result • Nurses spend most of their time (40-60%) at the nurse station, 17-37% in the patient room (see the first figure). • Most frequently traveled area is the nurse station and the surrounding area. • Future Work • Statistical Bayesian models will be built to characterize the nurse motion, such as frequent path patterns and the travel distance. This model will be based on the architectural layout of locations. Colored nodes are IPS receivers. Green nodes are for hallway receivers, pink for rooms, mainly, patient rooms, blue for nurse stations. A Link between two nodes represents the path from one node to another. The two numbers on each edge are the frequencies that the nurse travels from one node to another.