Download
1 / 5
50 likes | 89 Views
Find cut-off values for positive antigen responses in Uganda, The Gambia, and South Africa, with detection limits and correlation matrices included. Precise standards for IFN-g responses and ELISA assays in African populations.

E N D
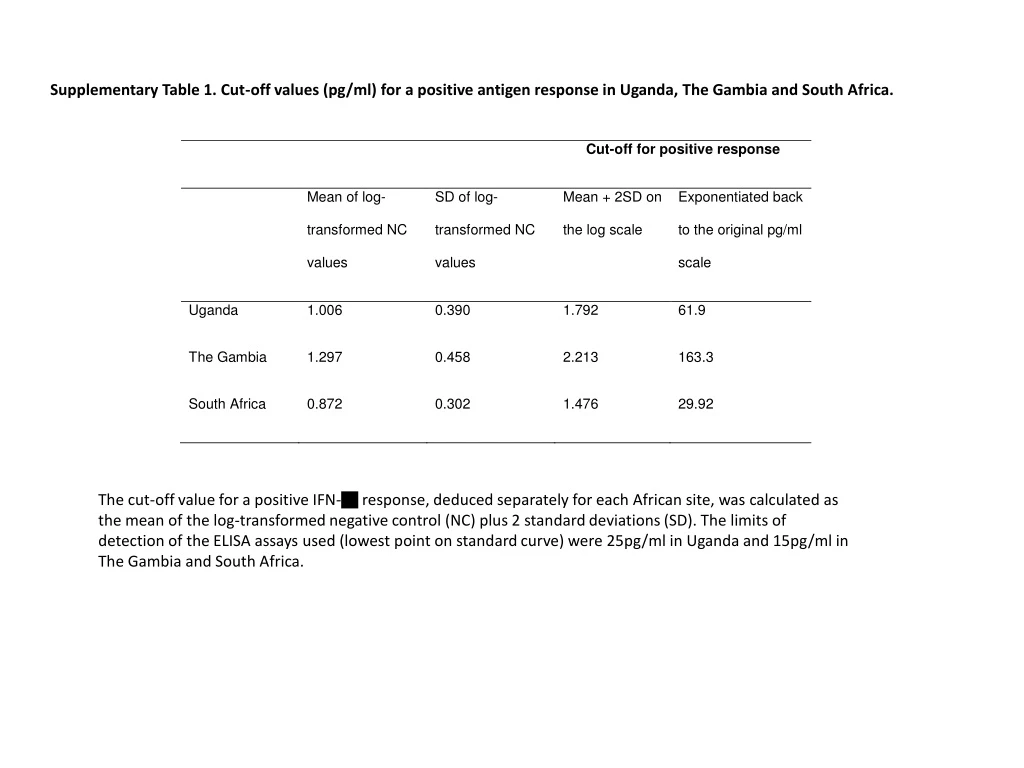
Supplementary Table 1. Cut-off values (pg/ml) for a positive antigen response in Uganda, The Gambia and South Africa. The cut-off value for a positive IFN-g response, deduced separately for each African site, was calculated as the mean of the log-transformed negative control (NC) plus 2 standard deviations (SD). The limits of detection of the ELISA assays used (lowest point on standard curve) were 25pg/ml in Uganda and 15pg/ml in The Gambia and South Africa.
Supplementary Table 2.Geometric means, medians, interquartile ranges, and percent positive responses to seven classical Mtb control antigens and PHA. aGeo Mean = geometric mean. bIQR = interquartile range. cN = number of participants tested. Ag85A and Ag85B protein antigens were combined to create a single stimulatory condition with each protein being tested at a final concentration of 10mg/ml.
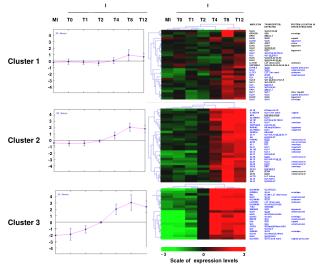
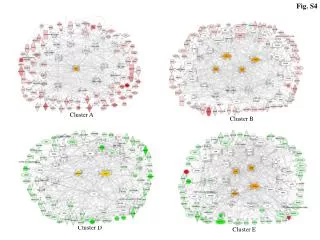
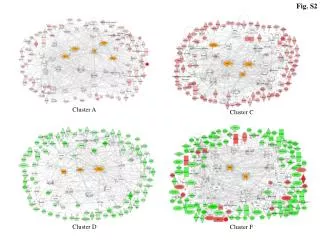
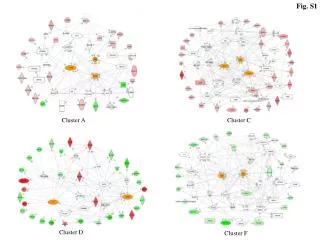
Supplementary Tables 3 A–C. Correlation matrices showing sites with Pearson’s correlation coefficient >= 0.6 for pair-wise comparisons of IFN-g responses to antigens within clusters 1 to 3. A. Antigen cluster 1
C. Antigen cluster 3. Antigens were clustered together if they had pair-wise data available at all three African sites and were also included in the top 19 most frequently recognized antigens shown in Table 3. Sites with large associations (r > 0.6) between antigen pairs are shown to the right/above the diagonal aMAK = Uganda. bMRC = The Gambia. cSUN = South Africa. dM/M/S = Uganda, The Gambia and South Africa. Where MMS is shown a large association was observed at all three sites. If a correlation co-efficient > 0.6 was observed for more than one site, the smallest r value is shown.