Fig. 12-2
140 likes | 341 Views
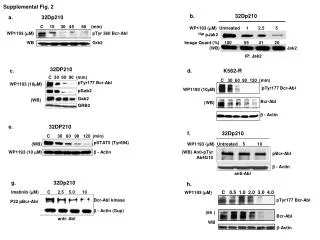
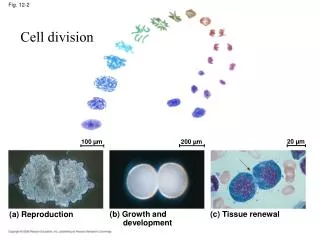
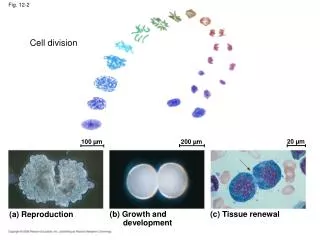
20 µm. 100 µm. 200 µm. (a) Reproduction. (b) Growth and development. (c) Tissue renewal. Cell division. Fig. 12-2. Types of cell divisions that produce identical offspring (clones) in various organisms. Binary fission (prokaryotes) Mitosis (eukaryotes). Figure 12.13. Cell wall.

Fig. 12-2
E N D
Presentation Transcript
20 µm 100 µm 200 µm (a) Reproduction (b) Growth and development (c) Tissue renewal Cell division Fig. 12-2
Types of cell divisions that produce identical offspring (clones) in various organisms Binary fission (prokaryotes) Mitosis (eukaryotes) Figure 12.13
Cell wall Origin ofreplication Plasma membrane E. coli cell Bacterial chromosome 1 Chromosomereplicationbegins. Two copies of origin Figure 12.12-4 2 Origin Origin Replicationcontinues. 3 Replicationfinishes. 4 Two daughtercells result.
Self organization of proteins involved in binary fission The oscillation of Min proteins from end to end in a bacterium confines the Z ring (composed of FtsZ protein filaments) to the mid-cell region, where the final stage of cell division will occur. Fluorescently labeled MinD (green) and FtsZ (red) are shown in an E. coli cell. Lutkenhaus, J. (2008). "BIOCHEMISTRY: Tinkering with Acellular Division." Science 320(5877): 755-756.
ChromosomalDNA molecules 0.5 µm Chromosomes Centromere 1 Eukaryotic chromosomes are larger and more complex Chromosomearm Figure 12.5-3 Chromosome duplication(including DNA replication)and condensation Centromere 2 Sisterchromatids Separation of sisterchromatids intotwo chromosomes 3 Sister chromatids
INTERPHASE S(DNA synthesis) G1 Figure 12.6 Cytokinesis G2 Mitosis MITOTIC(M) PHASE The cell cycle
The Fucci cell cycle visualization method. Cells in phase G1 fluoresce bright red. As they transition into the S phase and begin DNA replication, Cdt1 levels are dramatically reduced while Geminin levels increase. This results in faint yellow fluorescence early in G1/S that soon gives way to robust green fluorescence, which lasts until the cell re-enters G1 phase. Sakaue-Sawano, A.,et al. Visualizing spatiotemporal dynamics of multicellular cell-cycle progression. Cell132, 487–498 (2008).
10 µm TELOPHASE AND CYTOKINESIS METAPHASE ANAPHASE G2 OF INTERPHASE PROPHASE PROMETAPHASE Mitosis in plant cells LE 12-6ca
Prometaphase G2 of Interphase Prophase Fragments of nuclearenvelope Centrosomes(with centriole pairs) Early mitoticspindle Nonkinetochoremicrotubules Chromatin(duplicated) Aster Figure 12.7a Centromere Plasmamembrane Kinetochore Nucleolus Kinetochoremicrotubule Chromosome, consistingof two sister chromatids Nuclearenvelope
Metaphase Anaphase Telophase and Cytokinesis Nucleolusforming Metaphase plate Cleavagefurrow Figure 12.7b Nuclearenvelopeforming Spindle Centrosome atone spindle pole Daughterchromosomes
Microtubular spindel apparatus Centrosome Aster Metaphaseplate(imaginary) Sisterchromatids Microtubules Figure 12.8 Chromosomes Kineto-chores Centrosome 1 m Overlappingnonkinetochoremicrotubules Kinetochoremicrotubules 0.5 m
EXPERIMENT Kinetochore Spindlepole Mark Figure 12.9 RESULTS CONCLUSION Chromosomemovement Kinetochore Microtubule Tubulinsubunits Motor protein Chromosome
Mitosis in plant cells Chromatincondensing Nucleus Figure 12.11 10 m Nucleolus Chromosomes Cell plate 3 4 5 2 Anaphase 1 Prophase Metaphase Telophase Prometaphase
(a) Cleavage of an animal cell (SEM) (b) Cell plate formation in a plant cell (TEM) Figure 12.10 100 m Vesiclesformingcell plate Cleavage furrow Wall of parent cell 1 m New cell wall Cell plate Daughter cells Contractile ring ofmicrofilaments Daughter cells