Download
1 / 35
390 likes | 718 Views
NADCA Die Materials Committee Meeting. EFFECT OF DESIGN FACTORS ON THERMAL FATIGUE CRACKING OF DIE CASTING DIES. John F. Wallace David Schwam Sebastian Birceanu Case Western Reserve University. Rosemont, March 6, 2002. EFFECT OF MAXIMUM TEMPERATURE ON THERMAL FATIGUE DAMAGE OBJECTIVE

E N D
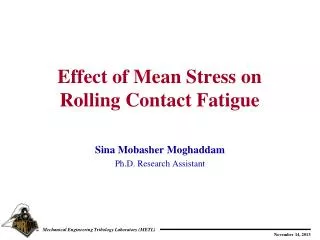
NADCA Die Materials Committee Meeting EFFECT OF DESIGN FACTORS ON THERMAL FATIGUE CRACKING OF DIE CASTING DIES John F. Wallace David Schwam Sebastian Birceanu Case Western Reserve University Rosemont, March 6, 2002
EFFECT OF MAXIMUM TEMPERATURE ON THERMAL FATIGUE DAMAGE OBJECTIVE • Determine the effect of the maximum temperature on the thermal fatigue cracking at the corners of the 2x2x7” H13 specimen. APPROACH (1) Vary the immersion time (5, 7, 9, 12 sec.), while the overall cycle time remains the same (36 sec). (2) Vary the cooling line diameter 1.5”, 1.6”, [1.7”], 1.8”), without changing the cycle time (9 sec. immersion time, 36 sec overall cycle time.)
(1) Variation in the immersion time “Up” motion travel time + “Down” motion travel time ~ 2sec
0.1 in (2.54 mm) 3.5 in (89 mm) Corner Temperature Measurement Setup T/C Junction
12 sec immersion time 9 sec immersion time
12 9 12 9 7 5 7 12 5 7 9
MICRO-HARDNESS MEASUREMENT • The hardness is measured at the center of the specimen,beginning at • 0.01 in (0.254 mm) from the edge. • • The next testing steps: 0.02in (0.508 mm), 0.04in (1.016 mm), • 0.06in (1.524mm), 0.08in (2.032mm), 0.1 (2.54mm), 0.15in , 0.2in • then in 0.1in increments until no further variation of hardness occurrs 3.5 in(89 mm) 7 in(178 mm)
Note: Longer immersion times cause more severe softening 5 sec 7 sec 9 sec 12 sec
The loss in hardness is most severe at the corner and becomes less severe further away
Distribution of the Carbides in the Thermal Fatigue Specimen A mechanism of softening at the corners is carbide coarsening
MECHANISM OF THERMAL FATIGUE CRACK NUCLEATION AND PROPAGATION • Most new H13 die have sufficient strength to resist immediate • formation of cracks. • After being exposed to thermal fatigue cycling, the hot areas • of the die will soften, thereby losing strength. When the fatigue • strength of the steel drops below the operating stresses cracks • will form and propagate. • Crack propagation is gradual and controlled by the gradual • softening that progresses with time deeper into the die. • Note: If the operating thermal stresses combined with stress • concentration factors exceed the fatigue strength of the steel, • fatigue cracks can propagate even w/o softening.
1.5” 1.6” 1.8” (2) Variation of the cooling line diameter D = 1.5 “ D = 1.6 “ D = 1.8 “
1.5” 1.6” 1.8”
1.5” 1.6” 1.8”
1.5” 1.6” 1.8”
Experimental Data for Stress in the 1.5 “Cooling Line of 2x2x7 H13 Specimen Stress [psi] Time [sec]
Details of Through Cracks on Sides of 2x2x7” Specimen (annealed; off-center cooling line, 5000 cycles)
Crack Length [m] Crack Distribution on Sides of 2x2x7” H13 Specimen (annealed; 5000 cycles)
Details of the Largest Cracks on Sides of 2x2x7” H13 Specimen (annealed; 5000 cycles)
CONCLUSIONS • Below a certain temperature threshold the thermal fatigue damage is minimal; this observation applies to the ground 2”x2”x7” H13 specimen tested to 15,000 cycles, in the absence of high stress concentrators. • The thermal fatigue damage is mainly determined by the temperature-time cycle, the thermal stresses and the softening of the specimen. • A longer dwell time at high temperature is more damaging than • a short one. This is because of the accelerated softening effect at • high temperature.
CONCLUSIONS (continued) • Long dwell times at high temperature simulate die casting of large components, where the die surface is subjected to elevated temperature for longer periods of time. • The experimental results demonstrate less thermal fatigue damage when the cooling line is closer to the surface and lowers the temperature. • However, bringing the cooling lines closer to the surface may cause high hoop stresses in the cooling line and at the surface. This may increase the danger of gross cracking.
METHODS OF KEEPING “HOT SPOTS” IN DIES BELOW CRITICAL TEMPERATURE 1. Longer cycle time that allows die to cool - slows production. 2. More insulating die lubricants - slows production. 3. More water spray - danger of thermal shock. 4. Die materials with better heat diffusivity. 5. Larger cooling lines drilled closer to hot spots - accessibility. 6. Optimized use of Baffles and Bubblers.
EVALUATION OF BAFFLES AND BUBBLERS • OBJECTIVE • Compare the efficiency of commercially available baffles and • bubblers in removing heat from “hot spots”. • METHOD • Use standard size OD/ Length H13 specimen inside furnace. • Vary internal cooling line diameter and water flow rate. • Use inter- changeable baffles and bubblers. • Compare outlet water temperature and specimen temperature • for constant inlet temperature.
Set-up for Evaluation of Baffles and Bubblers Water Outlet Meter for Flow Rate and Temperature Water Inlet Flow Specimen Data Acquisition Furnace
Set-up for Evaluation of Baffles and Bubblers Water Inlet Water Outlet Flow Meter Furnace
Schematic of Baffle-cooled specimen Baffle Water-out Water-in Water flow Hole for Thermocouple HOT SPOT!
Schematic of Bubbler-Cooled Specimen Water In Bubbler Water Out Hole for Thermocouple HOT SPOT!
INTERIM CONCLUSIONS • For identical water flow rates, smaller diameter bubblers • generate a higher flow velocity and are more efficient in • cooling a localized hot spot. • Baffles and bubblers can be used to reduce the local temperature • of “hot spots” in the die below critical temperatures that • accelerate soldering. • Surgical needle-size bubblers are commercially available for • cooling hard-to-access hot spots and thin sections. • Further experiments are planned to compare the cooling • efficiency of different designs of baffles and bubblers.