Download
1 / 24
240 likes | 395 Views
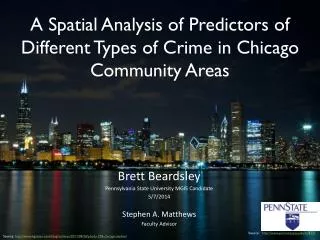
A Spatial Analysis of Predictors of Different Types of Crime in Chicago Community Areas. Brett Beardsley Pennsylvania State University MGIS Candidate Geog 596A 12/19/13 Stephen A. Matthews Faculty Advisor. Source: http://www.personal.psu.edu/zul112/.

E N D
ASpatial Analysis of Predictors of Different Types of Crime in Chicago Community Areas Brett Beardsley Pennsylvania State University MGIS Candidate Geog 596A 12/19/13 Stephen A. Matthews Faculty Advisor Source:http://www.personal.psu.edu/zul112/ Source: http://www.kgarner.com/blog/archives/2011/08/26/photo-238-chicago-skyline/
Outline • Background • Goals and Objectives • Proposed Methodology • Work Completed • Hypothesis • Timeline
Background • Chicago is the 3rd Largest City in the United States with 2.7 million people • Much higher rates of crime than New York City and Los Angeles Source: http://marshallmashup.usc.edu/taking-part-in-uscs-most-respected-rivalry-the-notre-dame-game/ Source: http://www.chicagoclout.com/weblog/archives/2008/04/
Literature Review • Spatial crime studies increasingly popular • Origins date back to 1820s(France) • Data and methods have evolved
Chicago Studies • Focused on 5 studies from 1990-2009 • All regression or modeling techniques • Numerous standard outcome and predictor variables
Previous Studies’ Conclusions • Surrounding areas have an effect on one another (i.e., Spatial dependence matters) • Traditional indicators of crime ring true (e.g. unemployment, poverty, population density) • Not every variation can be explained
Goals and Objectives • Analyze homicide, aggravated assault, criminal sexual assault, robbery, burglary, motor vehicle theft, larceny/theft, and arson within the 77 Community Areas in Chicago from 2007 to 2011 • Identify most influential factors of crime in Chicago Community Areas • Identify common themes in high crime areas • Identify how strong of an affect surrounding community areas have on one another
Variables Predictor Variables • Outcome Variables *rate per 100,000 people Source: http://www.ucrdatatool.gov/
Time Frame and Unit of • Analysis • 2007-2011 • 77 Chicago Community Areas
Methodology • Step 1: Collect the data • Step 2: Manipulate data • Step 3: Analyze manipulated data
Data Collection • Crime data came from the Chicago Police Department • Retrieved some ready to use predictor variable data from the Chicago Data Portal • Most of the predictor variables came from the 5 year (2007-2011) American Community Survey (ACS) Source: https://portal.chicagopolice.org/portal/page/portal/ClearPath Source: https://data.cityofchicago.org/ Source: http://njplanning.org/position-statements/take-action-now-support-the-american-community-survey/
Data Manipulation • Combined all crime data over the 5 year span • Determined which attributes I needed from ACS data • Create centroids for each Community Area • Assigned 805 modified ACS tracts a Community Area name and number based on location to centroids • Dissolve ACS tracts by Community Area name and number and compiled statistics for each • Spatially joined 805 modified ACS tracts to 77 Community Area Centroids based on Community Area name and number • Finally did field calculations for percentages and means
Preliminary Analysis • Map each outcome and predictor variable by Community Area • Visually identify patterns and irregularities • Descriptive analysis-mean, standard deviation, min, and max
Further Analysis • As shown there is likely spatial autocorrelation within both the outcome and predictor variables and correlation between them. Calculate Moran's I (global) and LISA (local) spatial autocorrelation/dependence measures • Create spatial weights matrices in GeoDa • Run Ordinary Least Squares (OLS) regression models using spatial weights matrices on all crimes, violent crimes, property crimes, and finally each individual crime. • Check model assumptions and regression diagnostics • As necessary run spatial lag or spatial error models .
Hypotheses • Affect of surrounding neighborhoods will be strong • Percent of vacant housing will have the most influence on total crime rate
Limitations • Small number of observations for the unit of analysis (77) • ACS is an estimate
Timeline • Winter 2014-Perform more advanced analysis on data and finish paper • Spring-2014-Present at ILGISA Regional Conference
Acknowledgements • Advisor-Stephen A. Matthews • Geography 586 Instructor-David O’Sullivan • Capstone Workshop-Pat Kennelly • Overall Guidance-Doug Miller and Beth King
References • Arnio, A. N. & Baumer, E. P. (2012). Demography, foreclosure, and crime: Assessing spatial heterogeneity in contemporary models of neighborhood crime rates. Demographic Research 26:18, 449-488. • Berg, M.T., Brunson, R.K., Stewart, E.A., & Simons, R.L (2011). Neighborhood Cultural Heterogeneity and Adolescent Violence. Journal of Quantitative Criminology 28, 411-435. • Boggs, S. (1965). Urban Crime Patterns. American Sociological Review 30:6. 899-908. • Bowers, K. & Hirschfield, A. (1999). Exploring links between crime and disadvantage in north-west England: an analysis using geographical information systems. International Journal of Geographical Information Science 13:2. 159-184. • Ceccato, V. (2005). Homicide in Sao Paulo, Brazil: Assessing spatial-temporal and weather variations. Journal of Environmental Psychology 25:3, 307-321. • Earls, F., Morenoff, J.D, & Sampson, R.J. (1999). Beyond Social Capital: Spatial Dynamics of Collective Efficacy for Children. American Sociological Review 64:5, 633-660. • Graif, C. & Sampson, R. J. (2009). Spatial Heterogeneity in the Effects of Immigration and Diversity on Neighborhood Homicide Rates. Homicide Studies13:3, 242-260. • Matthews, S.A., Yang T-C., Hayslett, K.L., & Ruback, R.B. (2010). Built environment and property crime in Seattle, 1998-2000: a Bayesian analysis. Environment and Planning 42:6, 1403-1420. • Morenoff, J.D. (2003). Neighborhood Mechanisms and the Spatial Dynamics of Birth Weight. American Journal of Sociology 108:5, 976-1017. • Raudenbush, S.W., Sampson, R.J., & Sharkey, P. (2008). Durable effects of concentrated disadvantage on verbal ability among African-American children. Proceedings of the National Academy of Sciences105:3, 845-852. • Shaw, C.R. (1929). Delinquency Areas. Chicago: University of Chicago Press. • White, R.C. (1932). The Relation to Felonies to Environmental Factors in Indianapolis. Social Forces 10:4, 498-509.
Questions Brett Beardsley brett.a.beardsley@gmail.com