Download
1 / 24
240 likes | 263 Views
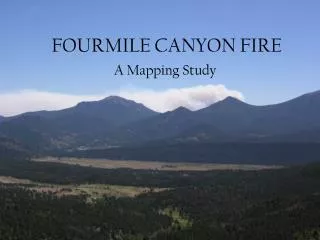
Creating a fire hazard map for Mission Canyon using variables like vegetation and slope to identify high-risk areas, aiding public awareness. Project methods involved mapping with overlays, buffers, and distance calculations. Collaboration with experts, such as Dr. Ray Smith and David Neels, was beneficial, while data accuracy and resolution posed challenges. Recommendations include prioritizing fire risk in development and increasing public awareness.

E N D
Mission Canyon Fire Prevention Eli Kersh-Oliva Delwin Leung Viviane Vincent Peter Thermos Tyler Eck
Data Sources Santa Barbara County Fire Captain David Neels Dr. Dar Roberts Dr. Ray Smith
Original Objective of Project • To create a potential fire hazard map using a combination of variables in a predictive model. • Vegetation, Slope, Streets and Houses would be used to determine areas of high risk. • The final map would provide the fire department with a tool to identify areas that needed greater attention. • To provide the MCPA with visual aids to create general public awareness.
Original Methods of Project • Mapping of the Mission Canyon through the use of: • Overlays • Buffer • Proximity • Euclidian Distance • Resample • Reclassify • Multicriteria Decision Making (AHP) • Raster Calculator
What Went Right • Excellent advice from faculty and County Fire included: Dr. Ray Smith, David Neels and Dar Roberts. • Once we had the data layers, our group was able to work with the data effectively. • Highly motivated group members and great group chemistry throughout the project.
What Went Wrong • Coordinating data between agencies was very difficult. We encountered many problems during this process. • Accuracy of data was a major issue, especially with the vegetation layer. • 30 meter resolution was the best that we could possible use and create.
What Else Went Wrong “It’s a good idea to use AHP, though software access will have to be worked out.” -Dr. Goodchild
Structure Distance to Vegetation Structure Distance to Road Slope Vegetation type Structure Distance to Vegetation 1 Structure Distance to Road 1 Slope 1 Vegetation Type 1 AHP Original template that we worked with.
Fuel Risk Structure further than 300 feet from roadway Slope Fuel Risk 1 8 1/7 Structure further than 300 feet from roadway 1/8 1 1/6 Slope 7 6 1 AHP David Neels’ estimate: AHP Matrix
AHP Final weights that were used: x=[1,8,.14286;.125,1,.16667;7,6,1] 0.2180 0.0574 0.7247
Key Lessons • Coordination with agencies and faculty. • Simplifying the methods. • Using real-world situation to create useful and informative maps for public and private use.
Recommendations • Fire risk needs to become the central issue of all future development and planning of Mission Canyon. • Identifying extremely high fire danger that would be potential candidates of brush clearance. • Greater public awareness for residents.