Java Monitoring
60 likes | 264 Views
Java Monitoring. Java monitoring using Glassfish, JMX, Glassbox and JConsole. by Greg Heithaus. Environment. JDK 1.6 - used for running NetBeans, Glassbox Inspector and the sample Spring application JDK 1.7 - used for running JConsole NetBeans 6.5 with Glassfish v2

Java Monitoring
E N D
Presentation Transcript
Java Monitoring Java monitoring using Glassfish, JMX, Glassbox and JConsole by Greg Heithaus
Environment • JDK 1.6 - used for running NetBeans, Glassbox Inspector and the sample Spring application • JDK 1.7 - used for running JConsole • NetBeans 6.5 with Glassfish v2 • Miscellaneous components from LAB-1420 : Monitoring and Troubleshooting using JMX and JConsole
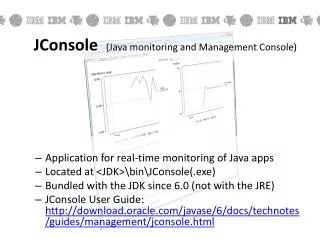
JMX, MBeans, and JConsole • JMX – Java Management Extensions • MBeans – The instrumentation component of JMX • JConsole – An interface implementation of the connector component of JMX
Glassbox Inspector • The Glassbox Sales Pitch (and the price is right): The Glassbox troubleshooter is an automated troubleshooting and monitoring agent for Java applications that diagnoses common problems with one-click. Drop it onto your existing Java Application Server (Tomcat, JBoss, WebSphere, WebLogic), either in production or testing. Because Glassbox's troubleshooting knowledge is built in, anyone can isolate a failing connection or a slow-running query instantly. It adapts to your application and pinpoints your errors or performance issue in plain English, and you no longer need to wade through log files and graphs.
On with the show • Demo Glassbox • Demo JConsole • Demo JConsole Plugin • Run through as many of these as we have time for: • Persist plotter data for offline analysis • Set memory thresholds for low memory detection • Walk through stack traces for the live threads and detect deadlocks • Enable verbose output for the memory system and set GC VM options at runtime • Obtain a heap dump and analyze it with the jhat tool • Check the value of a system property in the target VM • Change the log levels of the loggers of an application at runtime
References • Nice explanation of JMX and MBeans: http://en.wikipedia.org/wiki/Java_Management_Extensions • http://www.glassbox.com/glassbox • Sun stuff: NetBeans, Glassfish, Java, lots of other cool stuff: http://www.sun.com/ • Lab 1420: https://sjug.dev.java.net/files/documents/7123/128372/1420_jmxjconsole.zip