Download
1 / 22
220 likes | 427 Views
Performance Monitoring of Java Web Service -based Applications. W ł odzimierz Funika, Piotr Handzli k Lechos ł aw Tr ę bacz Institute of Computer Science, AGH, Krakow, Poland. Agenda. Review of existing monitoring systems JIMS (JMX) Lemon (CERN) Mercury

E N D
Performance Monitoring of Java Web Service-based Applications Włodzimierz Funika, Piotr Handzlik Lechosław Trębacz Institute of Computer Science, AGH, Krakow, Poland
Agenda • Review of existing monitoring systems • JIMS (JMX) • Lemon (CERN) • Mercury • Concept of a system monitoring WebServices • idea (J-OMIS, OCM-G) • metrics • feasibility study • architecture
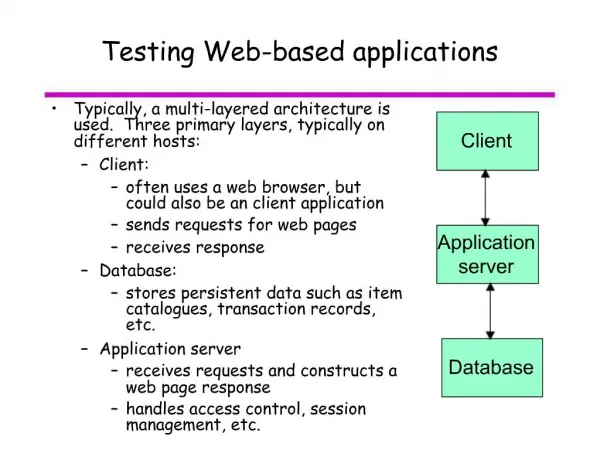
Monitoring System Funcionality Monitoring of application is observing, analyzing and manipulating the execution of the application, which gives information about threads, CPU usage, memory usage, informations about methods and classes. A particular case is monitoring of distributed applications where an additional issue is the performance analysis of nodes.
Functional requirements • Goals • monitoring Web Services • distinguishing which objects are interface of WS • accessing information about Web Services on a node • Communication related performance data • size of SOAP message • time of communication • time of parsing a SOAP message • Events • receive request • start/end of creating/parsing SOAP message • Basis • use the J-OMIS interface • hold the existing functionality of J-OCM • make use of experience with extending OMIS/OCM for parallel applications, grid computing and Java distributed programming.
JMX Infrastructure Monitoring System JIMS is a monitoring service for GRID’s, exposing the following parameters to the outside world: • CPU load, • Number of processes, • Memory usage, • Network interface utilization. It uses Java Native Interface, Java Management Extension, Dynamic Discovery Service and Web Services
JIMS Architecture Cluster Node JIMS RMI Node JIMS RMI SOAP Gateway SOAP User RMI Node JIMS
LEMON (CERN) Lemon is a scalable and flexible fabric monitoring system. Distributed clients launch and control local sensors, schedule measurements, collect data and send them to one or several repositories. The system provides sensors for common performance and exception monitoring. Main parts of Lemon are: • Monitoring Sensormeasures data • Monitoring Sensor Agent exists on all nodes and provides transport to MR • Monitoring Repository(MR) with backend to Oracle, MySQL, flat file,… • Alarm Broker– daemon for handling exceptions and communication between alarm GUI and MR • Round Robin Database – is used to store and to manipulate data
Lemon architecture Alarm GUI Monitoring repository backend Alarm Broker Monitoring repository RRD Tool Framework Node Monitoring Sensor Agent USERS Monitoring Sensor Monitoring Sensor
Lemon - Performance Monitoring • In Lemon there areseveral types of data: • Performance metrics: • CPU usage, load averages, memory usage, disk usage/performance, sockets, network, … • Exceptions: • High load, swap usage over 90%, service down,… • Status information: • Uptime, boot time, kernel version,… • Heartbeat • Data is gathered with different frequencies from 60s to 1 day/on boot
Mercury (GridLab) The architecture of Mercury Monitor is based on the Grid Monitoring Architecture proposed by Global Grid Forum (GGF), and implemented in a modular way. The Mercury Monitor provides: • monitoring data as metrics, • pull and push model, • performance monitoring and steering, • monitoring of grid entities such as resources and applications, • emphasis on simplicity, efficiency, portability and low intrusiveness.
Mercury (GridLab) The input of the monitoring system consists of measurements generated by sensors. Sensors are implemented as shared objects that are dynamically loaded at run-time depending on configuration and incoming requests for different measurements. Local monitor employs a set of sensors, implemented as loadable modules, to collect information about the local node, including host status, applications, etc., and sends it to the main monitor. The monitoring service sends requests to local monitors.
Mercury architecture Tool MM node 2 node 1 LM LM Sensor Sensor Sensor Sensor
Idea Our monitoring system will be based on J-OMIS interface and its implementation, J-OCM. The work dates back to 1995 when OMIS, a monitor/tool interface specification was released. Java-bound OMIS is a monitor extension to OMIS for Java applications intended to support the development of Java distributed applications with on-line tools. J-OMIS specifies three types of services: • information (providing information about an object) • manipulation (allowing to change the state of an object) • event (trigger arbitrary actions whenever a matching event takes place)
J-OCM architecture Tool 1 Tool 2 Node Distribution Unit Node Node Local Monitor (RMI Ext, JVM Ext) Local Monitor (RMI Ext, JVM Ext) JVM agent JVM agent JVM agent JVM agent
J-OCM Node Distribution Unit is part, which is still responsible for distributing requests and assembling replies. Local Monitor is a monitor process. LM’s extension provides new services defined by J-OMIS, which control Java Virtual Machine via agent. LM stores information about the target Java application’s object, such as JVMs, threads, classes, interfaces, objects, methods, etc., referred to by tokens. Agent uses JVM native interfaces such as JVM Profiler Interface, JVM Debugging Interface, Java Native Interface to access low-level mechanism for interactive monitoring of JVM.
Grid-enabled OMIS-based Monitor The OCM-G is a decentralized, distributed system, consists of two types of components: • Service Managers (SM) • Local Monitors (LM) SMs reside permanently, one on each site of the Grid, where are application processes to be monitored. LMs execute OMIS request accepted from SMs and send the results back. LMs handle only objects which are on the same host. The LMs use OS mechanisms to control the application processes.
OCM-G Monitoring Services The OCM-G provides: • Debugging services (services for suspending/continuing process, reading/writing processes’ memory, etc.) • Performance analysis services, for example: • services for detecting the beginnings and ends of function calls, • services for handling probes, which are used by the user to define and detect arbitrary events in an application, • services for the creation and management of counters and integrators - efficient data structures which allow to buffer and preprocess monitoring information in the context of the application.
Components of our system It contains three kinds of components: • application monitor (AM), • node's local monitor(LM), • service monitor (SM). AM is embedded into the application (in our case Web Service or application, which use Web Services). It isused to perform monitoring activities in the context of the application. It uses JVM Tool Interface, starting with JDK 1.5, for monitoring JVM. Node's local monitor is created on eachnode, where there are Web Services to be monitored. LM receives requests from Service monitor and transfers this request to AM. LM sends areply from AM to SM. Service Monitor resides permanently and exposes the monitoring services to tools.
Metrics Our monitoring system have two types of metrics: • static – for WebServices, intended for observation and analysis of SOAP messages sended to and from a WebService (requests and responses): • number of WebServices on a node • request time, transport time, cache access time, response time, SOAP create/parsing time, computing time • size of SOAP message (sent, received) • usage (node resources) • dynamic – oriented towards applications which use WebServices: • function call, service invocation • number of exceptions (errors)
Feasibility study To build the Web Service we use JakartaTomcat and Apache Axis. Jakarta Tomcat is the servlet container: • open source, • reference platform, • simplicity of use, • universal tool for deploying web applications. Apache Axis is an implementation of the SOAPprotocol and enables creation of web services on Tomcat. J-OCM will be a low-level layer of the architecture extended by a special extension for web services.
Architecture Tools WebService Service monitor Service monitor Node Node node's local monitor node's local monitor AM AM AM AM WebService Tomcat+Axis WebService Tomcat+Axis WebService Tomcat+Axis WebService Tomcat+Axis