Mastering Independent t-Tests: A Comprehensive Guide
This guide provides an in-depth look at independent t-tests, focusing on hypothesis testing for two unrelated groups. It covers basic concepts, including effect size (d² and ω²), underlying assumptions, and the importance of normal distribution and homogeneity of variance. The tutorial details how to conduct independent t-tests using SPSS and Excel, including step-by-step instructions for analyzing and interpreting results. Whether you are testing one-tailed or two-tailed hypotheses, this guide equips you with essential knowledge for conducting and understanding independent t-tests.


Mastering Independent t-Tests: A Comprehensive Guide
E N D
Presentation Transcript
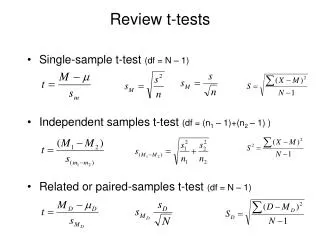
Features: One Independent Variable Two Groups, or Levels of the Independent Variable Independent Samples (Between-Groups): the two groups are not related in any way Interval/Ratio Measurement of the Dependent Variable Basic Concepts: The t-test divides the difference between the two means by the amount of variation within and between each of the two groups The t test statistic is normally distributed The tcv is determined based on the level of significance and the sample size (Degrees of Freedom) As degrees of freedom increase, the t-distribution becomes increasingly normal. Independent t-test
Hypothesis Testing: Independent Groups t-Ratio • Computational Formula, Unequal N • Computational Formula, Equal N
Interpreting the t-Ratio • d2: the effect size statistic for the two-sample t-ratio • Omega Squared (ω2): a statistical index of the degree to which the IV accounts for the variance in the DV OR Non-Directional Directional
The Independent t-Ratio and Its Assumptions • Parametric Test: an inferential statistic that makes specific assumptions about the population(s) from which the data are drawn • The samples are randomly selected; the scores are normally distributed • The samples are independent; the participants have been randomly assigned to groups • The distribution of error is the same across groups; homogeneity of variance
Computing the Independent t-testUsing SPSS • Enter data in the data editor or download the file. • Click analyze compare means independent sample t-test. The independent samples t-test dialog box should open. • Click on the independent variable, and click the arrow to move it to the grouping variable box. • Highlight the variable (? ?) in the grouping variable box. Click define groups. Enter the value 1 for group 1 and 2 for group 2. Click continue. • Click on the dependent variable, and click the arrow to place it in the test variable(s) box.
Interpreting the Output The group statistics box provides the mean, standard deviation, and number of participants for each group (level of the IV).
Interpreting the Output Levene’s test is designed to compare the equality of the error variance of the dependent variable between groups. We do not want this result to be significant. If it is significant, we must refer to the bottom t-test value. t is your test statistic and Sig. is its two-tailed probability. If testing a one-tailed hypothesis, we need to divide this value in half.df provides the degrees of freedom for the test, and mean difference provides the average difference in scores/values between the two groups.
Computing the Independent t-testUsing Excel • Enter the data for group 1 in column A; enter the data for group 2 in column B. • Go to tools data analysis. • Highlight t-test: Two samples assuming equal variances. Click OK. • Click in the variable one range window and highlight the data for group1. Do the same for group 2. • Click in the hypothesized mean difference box and enter 0. • Under output options, click the radio button to the left of output range. Click in the output range box and highlight an area of your spreadsheet to the side or below your data (about 15 rows by 3 columns). • Click OK. Adjust the width of the columns so you can see all of the information.
t-tests and Variability • Treatment Effects: conditions created by the IV that may cause groups to differ from one another (between-groups variance) • Random Effects: a variety of factors that influence the differences among subjects (within-groups variance) • Measurement Error: a broad class of errors that can influence the value of an observation; control for as many as possible • Individual Differences: characteristics of subjects that existed before the experiment and can influence the results; random assignment does not always ensure equality of individual differences
Correlated Groups Design • Standard Error of the Difference Between Means for the independent groups design: • More General Formula for the Standard Error of the Difference Between Means: • The r in the equation represents the correlation between groups. In the independent groups design, the correlation between groups should be 0.
Correlated Groups Design • Correlated Groups Designs: designs in which we do not randomly assign participants and there is an obvious relation between the two groups • Repeated Measures Design: the same subject is tested on two or more occasions (before-after) • Matched-Group Design: participants are matched on a variable that is believed to be related to the DV
Dependent (or Paired Samples) t-test • Has all of the features of the independent t-test except that the samples are dependent (paired; correlated). • t-Ratio for dependent groups:
Computing the Paired Samples t-test Using SPSS • Enter data in the data editor or open the file. • Click analyze compare means paired samples t-test. The paired samples t-test dialog box should open. • Hold down the shift key and click on the set of paired variables (the variables representing the data for each set of scores). Click the arrow to move them to the paired variables box. • Click OK.
Interpreting the Output The paired samples statistics box provides the mean, standard deviation, and number of participants for each measurement time. The test statistic box provides the mean difference between the two test times, the t-ratio associated with this difference, its two-tailed probability (Sig.), and the degrees of freedom associated with the design. As with the independent t-test, if testing a one-tailed hypothesis, divide the significance level in half.
Entering Between-Groups vs. Within-Groups Data in SPSS • In a between-groups design (independent t-test, one-way ANOVA, etc.): • The independent variable is entered in one column with value labels for the different levels of the IV • The values of the dependent variable are entered in one column. • With one IV and one DV, there will only be two columns of data, regardless of the number of levels of the IV. • In a within-groups design (dependent t-test, repeated measures ANOVA, etc.): • There are as many columns of data as there are levels of the IV. • The names of the columns should correspond with the levels of the IV. • The score/value for each measurement time is entered in the appropriate column.
Independent vs. Dependent Groups t-Ratio • In a dependent groups design, if you ignore the fact that groups are correlated and use the independent groups formula, the t-ratio will always be smaller. • This is because the error term in the denominator will be larger since the error due to individual differences has been ignored in the formula and has not been removed.