Mastering Parallel Performance Analysis with PPW: Techniques and Hands-On Experience
Join us for a comprehensive session on Parallel Performance Analysis with the Parallel Performance Wizard (PPW). This workshop will cover the fundamentals of performance analysis, tools for data collection, and approaches to optimizing parallel applications. You'll gain hands-on experience with instrumentation techniques and learn how to analyze performance data effectively. Our expert team, led by Dr. Vikas Aggarwal, will guide you through the complexities of high-performance computing and help you identify bottlenecks in your programs. Questions are encouraged throughout the session!

Mastering Parallel Performance Analysis with PPW: Techniques and Hands-On Experience
E N D
Presentation Transcript
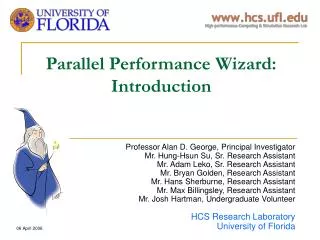
Performance Analysis with Parallel Performance Wizard Prashanth Prakash, Research Assistant Dr. Vikas Aggarwal, Research Scientist. Vrishali Hajare, Research Assistant Professor Alan D. George, Principal Investigator HCS Research Laboratory University of Florida
Outline • Introduction talk (~20 minutes) • Hands on • PPW basics • Performance data collection • Performance analysis • Automatic analysis Feel free to ask question during the talk or hands-on
Parallel Performance Analysis • The need for Performance Analysis • High-performance computing has performance as an explicit, fundamental goal • I just got my parallel program working, and… • My program does NOT yield the expected performance • Why is this? How do I fix my program? • The challenge of Performance Analysis • Understanding performance of sequential applications can be challenging • Complexity of parallel computing makes it more difficult to understand program performance without tools for performance analysis
Performance Analysis Approaches • Three general performance analysis approaches • Analytical modeling • Mostly predictive methods • Could also be used in conjunction with experimental performance measurement • Pros: easy to use, fast, can be performed without running the program • Cons: usually not very accurate • Simulation • Pros: allow performance estimation of program with various system architectures • Cons: slow, not generally applicable for regular UPC/SHMEM users • Experimental performance measurement • Strategy used by most modern performance analysis tools • Uses actual event measurement to perform analysis • Pros: most accurate • Cons: can be time-consuming (iterative tuning process)
Role of a Performance Analysis Tool Original Application Runtime Performance Data Gathering Data Processing and Analysis Optimized Application Data and Result Presentation
Performance Analysis Stages • Instrumentation Insertion of code to facilitate perf. measurement • Measurement Collection of perf. data at runtime • Analysis Examination & processing of perf. data to find & potentially resolve bottlenecks • Presentation Display of analyzed data to tool user • Optimization Modifying application to remove perf. problems
Instrumentation Techniques • Runtime/compiler instrumentation • Provides the most detailed information about user’s program • Requires vendor cooperation (modifications to compiler/runtime) • Source instrumentation • Directly modify user’s source code • Can provide much information, but may interfere with compiler optimizations • Interposition (“wrapper libraries”) • No recompilation needed, only relinking • Only get information about library calls • Can be difficult to get source-level information • Relies on alternate function entry points or dynamic linker hacks • Binary instrumentation • Most of the benefits of source instrumentation without need for recompilation • Can be difficult to get source-level information • Highly platform-specific, existing toolkits lack support for some platforms (eg, Cray)
Measurement Techniques • Profiling • Record statistical information about execution time and/or hardware counter values (PAPI) • Relate information to basic blocks (functions, upc_forall loops) in source code • Important concept: inclusive vs. exclusive time (self vs. total) • Tracing • Record full log of when events happen at runtime and how long • Gives very complete information about what happened at runtime • Requires much more storage space than profiling! • Sampling • Special low-overhead mode of profiling that attributes performance information via indirect measurement (samples)
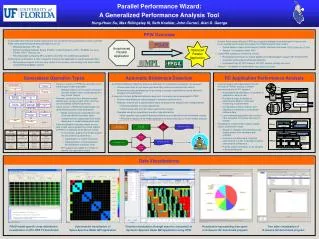
Parallel Performance Wizard (PPW) • Performance analysis tool developed in HCS Lab here at UF • Designed for partitioned global-address-space (PGAS) programming models (UPC and SHMEM) • Also supports MPI; other support in the works • Features • Uses experimental measurement approach • Provides profiling and tracing support • Has numerous visualizations and advanced automated analysis • Overarching design goals • Be user-friendly • Enhance productivity • Aim for portability
Hands-on • Boot liveDVD in a VM or directly or hardware • Initial Setup • Export PATH variable to include recent release of PPW and UPC • export PATH=/usr/local/packages/ppw-2.6.2/bin/:/usr/local/packages/bupc-2.12.1/bin/:$PATH • All applications we use today are in the directory • cd /home/livetau/workshop-point/UPC_apps • You can download these slides from (following slides has necessary commands and will come in handy), • http://hcs.ufl.edu/~prakash/pgas/PPW_Tutorial.ppt • http://hcs.ufl.edu/~prakash/pgas/PPW_Tutorial.pdf
Programming in UPC (bupc) • Compiling an UPC program • upcc hello.c –o hello • Execution • upcrun –n 4 hello
Using PPW in a Nutshell • Recompile application (Instrumentation) • Use ppwupcc instead of upcc • ppwshemecc (for SHMEM) and ppwmpicc (for MPI) • Run application (Measurement) • ppwrun <ppwrun options> <Command to execute parallel application> • View performance data (Analysis + Presentation) • ppw file.par • Change code (Optimization), recompile, repeat
PPW(for UPC) in a Nutshell • Recompile application (Instrumentation) • ppwupcc CAMEL_upc.c -o camel • Run application (Measurement) • ppwrun -–output=file.par upcrun –n 4 camel abcd1234 • View performance data (Analysis + Presentation) • ppw file.par • Change code (Optimization), recompile, repeat Note: PPW should be compiled --with-upc and Berkeley UPC should be compiled with --with-multiconf=+opt_inst
PPW Useful Options • Tracking user functions entry and exit • pass --inst-functions to ppwupcc • Communication matrix • pass --comm-stats to ppwrun • Just open the .par file using ppw to find all the data. • ppw file.par • Source archive (.sar file) • Required during execution • Retain the .sar file in the same directory as executable
NPB 2.4 • Compiling • cd NPB2.4/FT • make CLASS=X NP=N • where X can be S,A,B,C. • Preferably use S or A. • Execution same as before NPB2.4 is developed and maintained by George Washington University (upc.gwu.edu)
Tracing • Compilation is same as before using ppwupcc • Pass --trace option to request tracing • ppwrun --trace --output=a.par upcrun -n 4 ft.A.4 • Convert to slog2 using ppw (or par2slog2) • File -> Export -> <choose slog2> • Use jumpshot to view the trace • jumpshot ft.slog2
Export: Covert to Other Popular Formats • par file can be exported to different popular performance data formats, supported formats include • TAU profile • CUBE profile • OTF trace file (Vampir) • SLOG-2 (Jumpshot)
Case Study: Analyzing FT of NPB2.4 • NPB2.4 FT benchmark (class=A, np=4) executed on an IB cluster with 1 thread per node • You can download the par file and slog2 file at • http://hcs.ufl.edu/~prakash/pgas/ftA4.par • http://hcs.ufl.edu/~prakash/pgas/ftA4.slog2
Case Study: FT • Identify the bottleneck • Sort by total time, look for bottlenecks upc_getmem ft.c:1950 • Cannot be confirmed by looking at profile, so take a look at the trace • Observe the trace output and the behavior of the code section ft.c:1943 till ft.c:1953 • Serialization of upc_getmem, which is unnecessary in this case
Case Study: FT • How to fix? • Use bupc_getmem_async – Berkeley UPC extension for asynchronous getmem • http://upc.lbl.gov/publications/upc_memcpy.pdf • Did it improve performance? • Download the par file generated after changes to ft.c • http://hcs.ufl.edu/~prakash/pgas/ftA4_m.par • Observe the changes in profile data
Automatic Analysis • Why do we need automatic analysis? • Increasing size of performance data set makes it hard to identify and resolve bottlenecks • What will automatic analyses do? • Automatically detect, diagnose and possibly resolve bottlenecks
Automatic Analysis • Application analyses • Deals with a single run and includes, • Bottleneck detection • Cause analysis • High-level analysis • Experiment set analyses • Compare performance of related runs • Scalability analysis • Revision analysis
Application Analysis • Bottleneck detection • Examine profile data and identify the bottleneck profiling entries • Baseline comparisonand deviation evaluation method • Cause analysis • Identify the reason for bottlenecks and requires trace data to complete analysis • High-level analysis • High-level analysis is mainly used to detect bottleneck nodes that, when optimized, could improve the application performance for a single experiment
Application Analysis • Analysis -> Run Application Analysis
Experiment Set Analyses • Scalability analysis • Plots the scaling factor (relative speedup) values against the ideal scaling value • Scaling factor of 1.00 implies perfect scalability • Analysis->Run Scalability Analysis • Revision analysis • Compare and evaluate different versions of the same application • Profile Charts -> Total Times by Function
For More Information on PPW • Visit the PPW website • http://ppw.hcs.ufl.edu • Website has • Overview of tool • Links to detailed online/printable user manual • Downloadable source code for entire tool • Workstation GUI installers • Windows installer • Linux packages • Publications covering PPW and related research