Download

1 / 47
470 likes | 981 Views
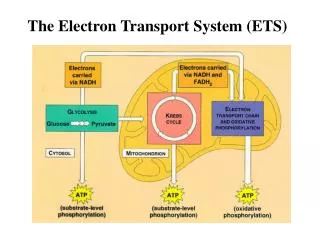
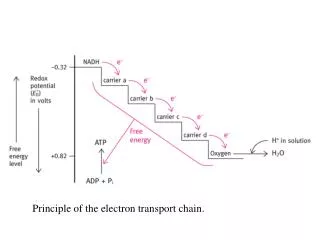
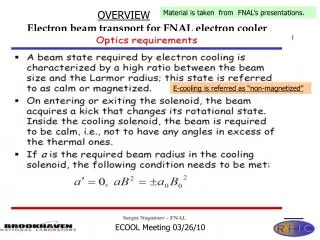
Figure 22-29 Coupling of electron transport ( green arrow ) and ATP synthesis. Page 821. Figure 22-30 The redox loop mechanism for electron transport–linked H + translocation. Page 822. ETC animation http://www.res.titech.ac.jp/~seibutu/. Figure 22-31 The Q cycle. Page 823.

E N D
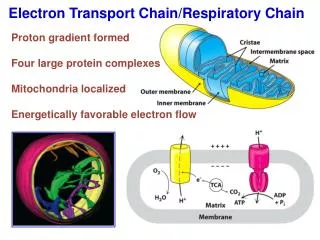
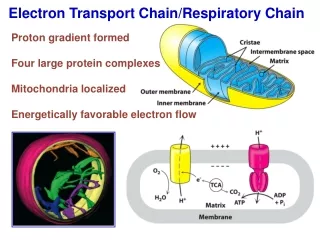
Figure 22-29 Coupling of electron transport (green arrow) and ATP synthesis. Page 821
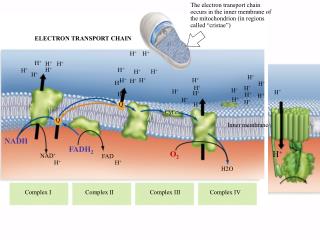
Figure 22-30 The redox loop mechanism for electron transport–linked H+ translocation. Page 822
Figure 22-31The Q cycle. Page 823
Figure 22-33 Proton pump mechanism of electron transport–linked proton translocation. Page 825
Figure 22-35 The proton-translocating channels in bovine COX. Page 826
Figure 22-36 Interpretive drawings of the mitochondrial membrane at various stages of dissection. Page 827
Figure 22-36 Electron micrographs of the mitochondrial membrane at various stages of dissection. (a) Cristae from intact mitochondria showing their F1 “lollipops” projecting into the matrix. (b) Submitochondrial particles, showing their outwardly projecting F1 lollipops. Page 827
Figure 22-38a X-Ray structure of F1–ATPase from bovine heart mitochondria. (a) A ribbon diagram. Page 828
Figure 22-38b X-Ray structure of F1–ATPase from bovine heart mitochondria. (b) Cross section through the electron density map of the protein.
Figure 22-38b X-Ray structure of F1–ATPase from bovine heart mitochondria. (b) Cross section through the electron density map of the protein. Page 828
Figure 22-41a Low (3.9 Å) resolution electron density map of the yeast mitochondrial F1–c10 complex. A view from within the inner mitochondrial membrane with the matrix above. Page 830
Figure 22-41b Low (3.9 Å) resolution electron density map of the yeast mitochondrial F1–c10 complex. (b) View from the intermembrane space of the boxed section of the c10 ring in the inset of Part a. Page 830
Figure 22-42 Energy-dependent binding change mechanism for ATP synthesis by proton-translocating ATP synthase. Page 831
Synthase Cartoon http://rsb.info.nih.gov/NeuroChem/biomach/ATPsyn.html#[I] Another animation: http://www.res.titech.ac.jp/~seibutu/
Figure 22-44a Rotation of the c-ring in E. coli F1F0–ATPase. (a) The experimental system used to observe the rotation. Page 832
Animation http://www.res.titech.ac.jp/~seibutu/projects/fig/f1rot_3.mpg Rotation of the gamma subunit of thermophilic F1-ATPas was observed directly with an epifluorescent microscope. The enzyme was immobilized on a coverslip through His-tag introduced at the N-termini of the beta subunit. Fluorescently labeled actinfilament was attached to the gammma subunit for the observation. Images of therotating particles were taken with a CCD camera attached to an image intensifierrecorded on an 8-mm video tape. (Noji et al. Nature 386 299-302 1997) Synthase Movie http://www.cnr.berkeley.edu/~hongwang/Project/ATP_synthase /QT_movies/F1_3d_sp_2.mov Synthase cartoon http://rsb.info.nih.gov/NeuroChem/biomach/ATPsyn.html#[I]
Figure 22-46 Uncoupling of oxidative phosphorylation. Page 834
Figure 22-47 Mechanism of hormonally induced uncoupling of oxidative phosphorylation. Page 835 brown fat mitochondria.
Figure 22-48 Schematic diagram depicting the coordinated control of glycolysis and the citric acid cycle by ATP, ADP, AMP, Pi, Ca2+, and the [NADH]/[NAD+] ratio (the vertical arrows indicate increases in this ratio). Page 837
Figure 23-1 Pathways converting lactate, pyruvate, and citric acid cycle intermediates to oxaloacetate. Page 844
Figure 23-2 Conversion of pyruvate to oxaloacetate and then to phosphoenolpyruvate. Page 845
Figure 23-3a Biotin and carboxybiotinyl–enzyme. (a) Biotin consists of an imidazoline ring that is cis-fused to a tetrahydrothiophene ring bearing a valerate side chain.
Figure 23-3b Biotin and carboxybiotinyl–enzyme. (b) In carboxybiotinyl–enzyme, N1 of the biotin ureido group is the carboxylation site. Page 845
Figure 23-4 Two-phase reaction mechanism of pyruvate carboxylase. Page 846
Figure 23-4 (continued) Two-phase reaction mechanism of pyruvate carboxylase. Phase II Page 846
Page 847 Figure 23-5 The PEPCK mechanism.
Figure 23-6 Transport of PEP and OAA from the mitochondrion to the cytosol. Page 847
Figure 23-7 Pathways of gluconeogenesis and glycolysis. Page 848
Table 23-1 Regulators of Gluconeogenic Enzyme Activity. Page 849
Figure 23-9 The Cori cycle. Page 850
Figure 23-10 The glyoxylate cycle. Page 851
Table 23-2 Sugar Nucleotides and Their Corresponding Monosaccharides in Glycosyltransferase Reactions. Page 852
Figure 23-21a Chemical structure of tunicamycin. (a) The structure of the glycosylation inhibitor tunicamycin. Page 859
Figure 23-26 The glucose-6-phosphate dehydrogenase reaction. Page 864
Figure 23-27 The phosphogluconate dehydrogenase reaction. Page 864
Figure 23-28 Ribulose- 5-phosphate isomerase and ribulose- 5-phosphate epimerase. Page 865
Figure 23-31 Summary of carbon skeleton rearrangements in the pentose phosphate pathway. Page 867