Download
1 / 33
330 likes | 355 Views
Learn about the Simple Regression Model, analyzing variables in terms of relationships, interpretations, and causal effects. Explore fitting regression lines, estimating models with data, and evaluating goodness-of-fit.

E N D
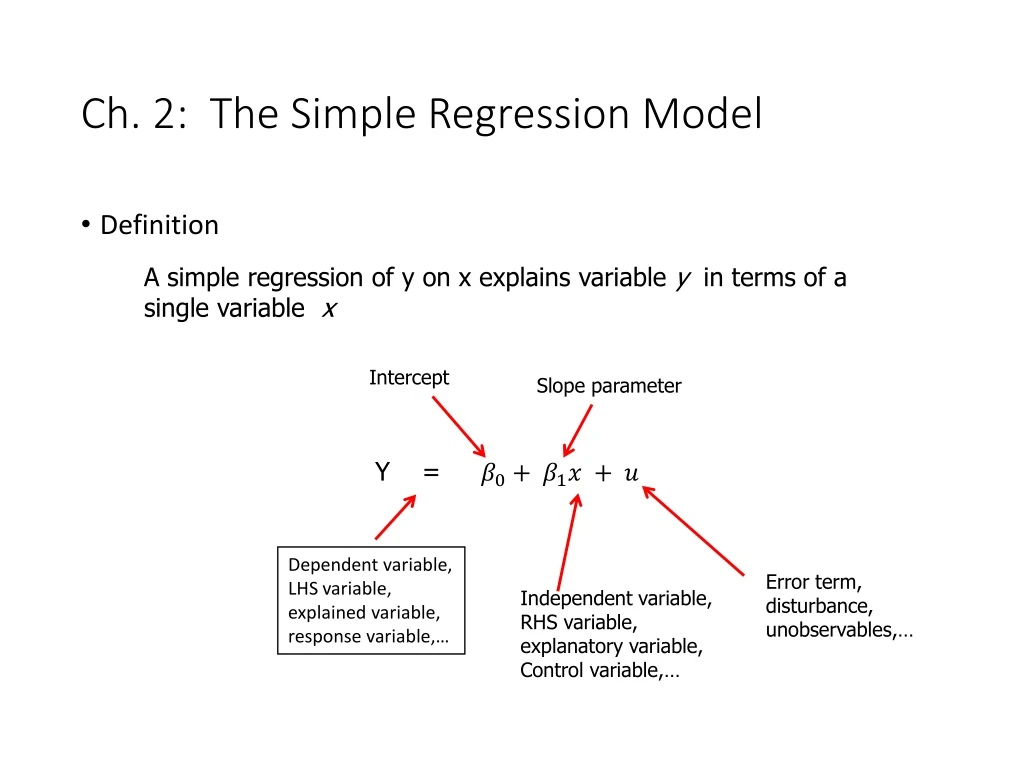
Ch. 2: The Simple Regression Model • Definition A simple regression of y on x explains variable y in terms of a single variable x Intercept Slope parameter Y = Dependent variable, LHS variable, explained variable, response variable,… Error term, disturbance, unobservables,… Independent variable,RHS variable, explanatory variable, Control variable,…
The Simple Regression Model • tt By how much does the dependent variable change if the independent variable is increased by one unit? Interpretation only correct if all other things remain equal when the independent variable is increased by one unit [i.e. cov(u,x)=0]
The Simple Regression Model • Example: Soybean yield and fertilizer • Example: A simple wage equation Rainfall, land quality, presence of parasites, … Measures the effect of fertilizer on yield, holding all other factors fixed Labor force experience, tenure with current employer, work ethic, intelligence, … Measures the change in hourly wage given another year of education, holding all other factors fixed
The Simple Regression Model • When is there a causal interpretation? • Conditional mean independence assumption • Example: wage equation The explanatory variable must not contain information about the mean of the unobserved factors e.g. intelligence …
The Simple Regression Model • Population regression function (PRF)The conditional mean independence assumption implies that • This means that the average value of the dependent variable can be expressed as a linear function of the explanatory variable
The Simple Regression Model Population regression function For individuals with , the average value of is
The Simple Regression Model • Deriving the ordinary least squares estimates • In order to estimate the regression model one needs data • A random sample of observations First observation Second observation Third observation Value of the dependent variable of the i-th ob- servation Value of the expla- natory variable of the i-th observation n-th observation
The Simple Regression Model • Fit as good as possible a regression line through the data points: Fitted regression line For example, the i-th data point
The Simple Regression Model • CEO Salary and return on equity • Fitted regression • Causal interpretation? Salary in thousands of dollars Average percentage return on equity of the CEO‘s firm (e.g. 6 = 6 percent return) Intercept If the return on equity increases by 1 percentage point, then salary is predicted to change by $18,501
The Simple Regression Model Fitted regression line (depends on sample) Unknown population regression line
The Simple Regression Model • Wage and education • Fitted regression • Causal interpretation? Hourly wage in dollars Years of education Intercept In the sample, one more year of education was associated with an increase in hourly wage by $0.54
The Simple Regression Model • Voting outcomes and campaign expenditures (two parties) • Fitted regression • Causal interpretation? Percentage of voteforcandidate A Percentage of campaign expenditures candidate A Intercept If candidate A‘s share of spending increases by one percentage point, he or she receives 0.464 percen- tage points more of the total vote
The Simple Regression Model Properties of OLS on any sample of data • Fitted values and residuals • Algebraic properties of OLS regression Fittedorpredictedvalues Deviationsfromregressionline (= residuals) Deviationsfromregressionlinesumuptozero Sample averages of y and x lie on regression line (regression line passes through the mean) Covariance between deviations and regressors is zero
The Simple Regression Model Forexample, CEO number 12‘s salary was $526,023 lower than predicted using the theinformation on hisfirm‘sreturn on equity
The Simple Regression Model • Goodness-of-Fit • Measures of Variation “How well does the explanatory variable explain the dependent variable?” Total sumofsquares, represents total variation in the dependent variable Explainedsumofsquares, representsvariation explainedbyregression Residual sumofsquares, representsvariationnot explainedbyregression
The Simple Regression Model • Decomposition of total variation • Goodness-of-fit measure (R-squared) Total variation Explainedpart Unexplainedpart R-squaredmeasuresthefractionofthe total variationthatisexplainedbytheregression
The Simple Regression Model The regression explains only 1.3% ofthe total variation in salaries The regression explains 85.6% of the total variation in election outcomes
The Simple Regression Model • Incorporating nonlinearities: Semi-logarithmic form • Regression of log wages on years of education • This changes the interpretation of the regression coefficient: Natural logarithm of wage Percentagechange of wage … ifyearsofeducation areincreasedbyoneyear
The Simple Regression Model • Fitted regression The wage increases by 8.3% for every additional yearofeducation (= return to another year of education) For example: Wage increases 8.3% per yearofeducation
The Simple Regression Model • Incorporating nonlinearities: Log-logarithmic form • CEO salary and firm sales • This changes the interpretation of the regression coefficient: Natural logarithm of CEO salary Natural logarithm of his/her firm‘ssales Percentagechange of salary … if sales increase by 1% Logarithmicchangesare alwayspercentagechanges
The Simple Regression Model • CEO salary and firm sales: fitted regression • For example: + 1% sales;+ 0.257% salary
The Simple Regression Model: Properties of Estimators • Expected values and variances of the OLS estimators • The estimated regression coefficients are random variables because they are calculated from a random sample • The question is what the estimators will estimate on average and how large their variability in repeated samples is Data israndom and depends on particular sample thathasbeendrawn
The Simple Regression Model Standard assumptions for the linear regression model • Assumption SLR.1 (Linear in parameters) • Assumption SLR.2 (Random sampling) In thepopulation, therelationship between y and x is linear The datais a random sample drawnfromthepopulation Eachdatapointthereforefollows thepopulationequation
The Simple Regression Model • Assumption SLR.3 (Sample variation in the explanatory variable) • Assumption SLR.4 (Zero conditional mean) The values of the explanatory variable are not all the same (otherwiseitwouldbeimpossibletostu- dyhow different valuesoftheexplanatory variable leadto different valuesofthedependent variable) The value of the explanatory variable must contain no information about the mean of the unobserved factors [i.e. Cov(u,x)=0]
The Simple Regression Model • Theorem 2.1 (Unbiasedness of OLS) • Interpretation of unbiasedness • The estimated coefficients may be smaller or larger, depending on the sample that is the result of a random draw • If sampling was repeated, on average, coefficients will be equal to the values that characterize the true relationship between y and x in the population • In a given sample, estimates may differ considerably from true values
The Simple Regression Model • Variances of the OLS estimators • Depending on the sample, the estimates will be nearer or farther away from the true population values • How far can we expect our estimates to be away from the true population values on average (= sampling variability)? • Sampling variability is measured by the estimator‘s variances • Assumption SLR.5 (Homoskedasticity) The valueoftheexplanatory variable must containnoinformationaboutthevariabilityoftheunobservedfactors
The Simple Regression Model • Graphical illustration of homoskedasticity The variabilityoftheunobserved influences does not depend on the value of the explanatory variable
The Simple Regression Model • An example for heteroskedasticity: Wage and education The varianceoftheunobserveddeterminantsofwagesincreases withthelevelofeducation
The Simple Regression Model Under assumptions SLR.1 – SLR.5:
The Simple Regression Model • Estimating the error variance The variance of u does not depend on x, i.e. equaltotheunconditionalvariance Can estimate the variance of the errorsbycalculatingthevarianceoftheresiduals in the sample; unfortunatelythisestimatewouldbebiased An unbiased estimate of the error variance can be obtained by substracting the number of estimated regression coefficients from the number of observations
The Simple Regression Model • Theorem 2.3 (Unbiasedness of the error variance) • Calculation of standard errors for regression coefficients Plug in for theunknown The estimated standard deviations of the regression coefficients are called “standard errors.”They measure how precisely the regression coefficients are estimated.


