Download
1 / 50
500 likes | 644 Views
Safety and Scientific Process. Objective 1 . TEK 1 The student, for at least 40% of the time, conducts field and laboratory investigations using safe, environmentally appropriate, and ethical practices. Demonstrate safe practices during field and laboratory investigations.

E N D
Objective 1 TEK 1 The student, for at least 40% of the time, conducts field and laboratory investigations using safe, environmentally appropriate, and ethical practices. • Demonstrate safe practices during field and laboratory investigations. TEK 2 The student uses scientific methods during field and laboratory investigations. • Plan and implement investigative procedures including asking questions formulating testable hypotheses, and selecting equipment and technology. • Collect data and make measurements with precision and accuracy. • Organize, analyze, evaluate, make inferences, and predict trends from data. • Communicate valid conclusions. TEK 3 The student uses critical thinking and scientific problem solving to make informed decisions. • Analyze, review, and critique scientific explanations, including hypotheses and theories. • Draw inferences based on data related to promotional materials for products and services.
The TEST You have to get 29 questions out of 55 to pass this test. Data shows that students who answer at least10 of17 correctly from objective 1usually pass.
General Safety Rules Basic Safety Rules • Never pipette by mouth. • Never use broken glassware. • Hot glass looks like cool glass. • Hot glass does not go in water. • Test tubes should be heated with the mouth away from people. • Always poor acid into water. • Never touch electrical devices with wet hands. • Never smell a chemical directly. • Never poor unknown chemicals down the sink. • Never return unused chemicals to the original container. • Never eat or drink in the lab. • Remain alert at all times. • Keep your area free of clutter. • Follow both written and verbal directions. • Students may not work alone. • Remain at your workstation. • Always wear goggles and other safety items. • Secure all loose items. • Hair should be pulled back. • Contacts are no allowed.
Safety Terms: Caustic or corrosive- Will corrode or eat away metal, skin, or other substances. Volatile- Evaporates quickly, may form dangerous vapors. Flammable (may ignite)- will catch on fire or explode easily. Ventilation- removing contaminated air and brining in fresh air.
Balance (not a triple beam) • To measure mass (weight) of substances or objects accurately NOT
graduated cylinder (graduate) • To measure volume of liquids accurately
SI Ruler(“Metric” is slang.) • To measure the lengths of solid objects accurately
oC SI thermometer • To measure temperature accurately
magnifying glass (hand lens) • To make objects appear larger than they are
Bunsen burner • To heat substances (with a flame)
hot plate • To heat substances using electricity, not a flame.
ring stand with clamp and ring • To hold containers away from a heat source (such as fire) during an experiment
safety goggles • To protect eyes against burns or cuts
microscope • To view specimens that are too small to see with the naked eye Molecular Expressions Microscopy Primer: Virtual Microscopy: Interactive Java Tutorials
slide • To hold a specimen (sample) for viewing through a microscope
cover slip • To cover a specimen (or sample) on a slide
medicine dropper(eyedropper) • To drop small amount of liquids
forceps • To pick up small items that you should not touch
Petri dish • To grow bacteria and other tiny living things
test tube • To hold liquids and chemicals during experiments (investigations)
test tube rack • To hold test tubes during an investigation. (After cleaning, test tubes can be placed upside down to dry.)
test tube tongs • To hold test tubes over heat or away from your body
test tube brush • To clean the insides of test tubes after investigations
Erlenmeyer flask • To hold liquids • NOT used to measure accurately
Florence flask • Used to hold liquids • NOT used to measure accurately
beaker • To hold, pour, or estimate liquids • NOT used to measure substances accurately
tongs • To pick up large objects that you should not touch (e.g., hot containers, flasks of acids, etc.)
Funnel To pour liquids from one container to another without spilling anything
stirring rod • To mix chemicals and hot liquids together (like a spoon)
litmus paper • To determine whether a liquid is an acid or a base
Accurate measurement When measuring distance: You will have a ruler on the side of your formula sheet. USE IT if you are asked to measure distance on a map or a length. You must measure accurately and precisely. The wrong answer choices will test to see if you do. Use Metrics!!!
You try it!!! Measure the length of a tile. Measure the width of your folder.
When measuring liquids: Wear goggles! Use a graduated cylinder or graduated pipette. Beakers are not accurate!!! Read the bottom of the meniscus (curved line formed by the water) on a graduated cylinder or burette. Check your units. Do they increase or decrease? Do they go up by 1.0, 0.1, or 5.0? Read carefully. Volume of irregular objects: Use a graduated cylinder to take volume by water displacement .
You try it!!! 14 mL
When massing solids: Wear goggles! Use a weigh boat or paper. Subtract out the weight of the container or paper to zero the balance. Clean up spills.
You try it!!! Read the balance with the weigh paper. Read the balance with the weigh paper and chemical. Now subtract.
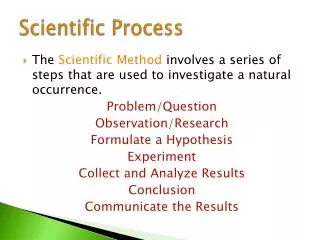
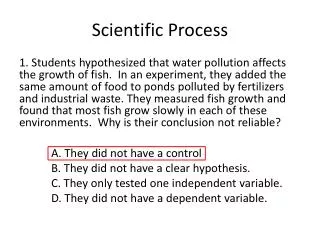
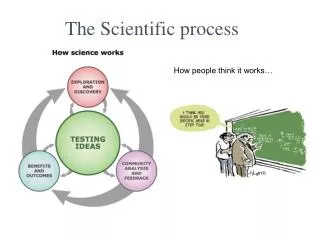
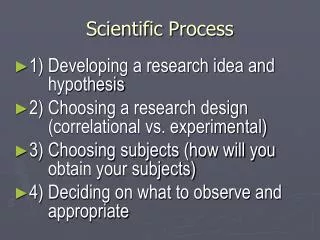
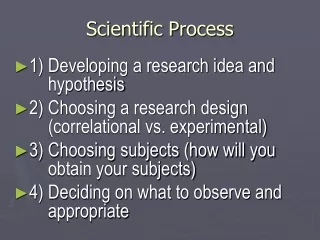
Experimental set-up/Scientific Method: When scientists begin an experiment they use the steps of the Scientific Method. You will be asked to do many of these steps on the test. The Problem (in the form of a question) that the scientists will try to answer, must be logical and based on data or observations. A prediction called a Hypothesis is next. It must be a testable statement that you could gather data to prove. (You can’t measure which is the “prettiest”, “strongest”, or “best”.)
You must control an experiment. You can test only one variable at a time. (How does the amount of water effect plant growth? Keep the light, containers, soil and plants the same.) Controls are kept the same in all trials. A Control Group is the set-up that isn’t changed. (One plant gets the normal amount of water!). The independent variable is the thing you change (amount of water). The dependent variable is the result of the change you made(height of plant in cm.). Controls: Light, type of plant, amount of soil, pot, temperature.
Independent variable: Amount of water given in mm. Dependent variable: Plant growth in cm.
The Conclusion must be supported by the data and results you gather. To be valid, each experiment needs a large sample size (grow 2000 plants in each experiment) and must be repeated many times in order to prove the Hypothesis (grow 2000 plants 100 times). If you are collecting samples, in an experiment, do it randomly. Don’t take them all from one place. Yes! No!
Reading Graphs and Making Calculations Some TAKS questions ask students to analyze graphs or do basic math calculations to solve problems or draw conclusions. The Independent Variable on a graph is on the X-axis. The Dependent variable is on the Y-axis.
Line graphs represent change over time. The steeper the slope of a line, the faster the change in time is occurring. Pie graphs represent %’s of a whole.
Pictographs use symbols to represent numbers. Always check keys and legends to accurately read units and labels on graphs. Bar graphs represent numbers of individuals or items in each category.
You may be asked to calculate a %. To find a %, dividethe # of items you have by the total #, then multiply by 100. Carefully read product labels and claims. Make sure you can separate fact from opinion.