Download
1 / 11
110 likes | 366 Views
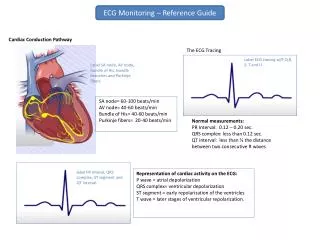
R. P. T. Q. S. Normal EKG. Q-T interval 0.35 sec. P-R interval 0.16 sec. R. P. T. Q. Ventricular repolarization. Atrial depolarization. S. Ventricular depolarization. Standardized EKGs. Time and voltage calibrations are standardized as shown on figure 11-1.

E N D
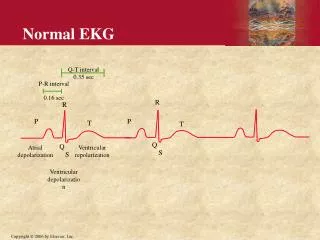
R P T Q S Normal EKG Q-T interval 0.35 sec P-R interval 0.16 sec R P T Q Ventricular repolarization Atrial depolarization S Ventricular depolarization
Standardized EKGs • Time and voltage calibrations are standardized as shown on figure 11-1. Figure 11-1; Guyton & Hall
Heart Rate Calculation • R-R interval = 0.83 sec • Heart rate = (60 sec)/(0.83 sec) = 72 beats/min min beat
Bipolar Limb Leads • Bipolar means that the EKG is recorded from two electrodes on the body. Figure 11-6; Guyton & Hall
Bipolar Limb Leads (cont’d) 0.5 mV 1.2 mV 0.7 mV Figure 11-7; Guyton & Hall
Other EKG Leads • Chest Leads (Precordial Leads) known as V1- V6 are very sensitive to electrical potential changes underneath the electrode. Figure 11-9; Guyton & Hall
Cardiac Cycle Figure 9-5; Guyton & Hall
Factors Affecting Cardiac Output Figure 20.20