Download
1 / 12
120 likes | 314 Views
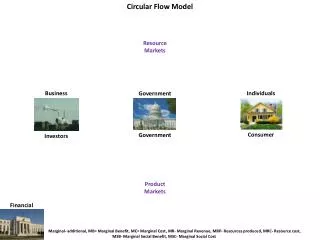
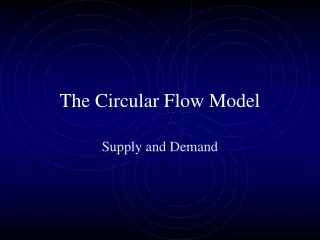
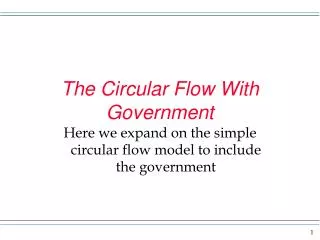
The Circular Flow With Government. Here we expand on the simple circular flow model to include the government. 8. Markets for factors of production (resources). 5. 1. 2. Households. Businesses. 4. 3. Markets for good and services. 7. 6.

E N D
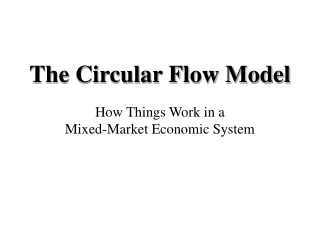
The Circular Flow With Government Here we expand on the simple circular flow model to include the government
8 Markets for factors of production (resources) 5 1 2 Households Businesses 4 3 Markets for good and services 7 6
Imagine this slide in really the middle part of slide 2 Resource Market 3 4 5 Households 6 Businesses Government 8 7 1 2 Product Market
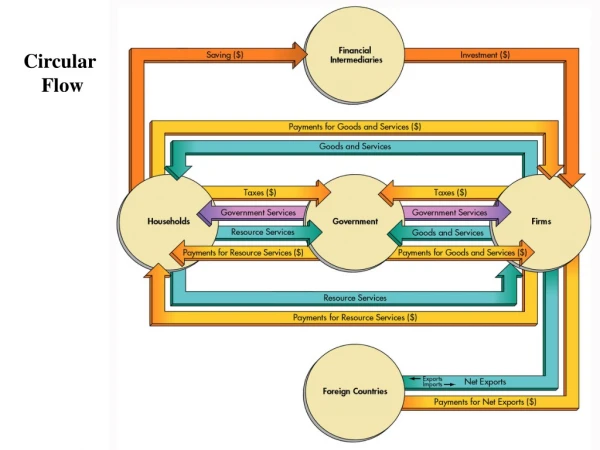
The expanded circular flow With the government added to the circular flow we see the government both takes resources from the resource market and goods and services from the product market. But, the government provides both the households and businesses with goods and services. Households and businesses send tax revenue toward the government. Let’s look at all these details more closely.
Flow 1 – This is a flow of money for the goods and services the government purchases. Flow 2 – This is the flow of goods and services to the government. These include the purchase of paper, computers and military hardware used by the government. Flow 3 – This is a flow of money for the resources the government purchases. Flow 4 - This is the flow of resources used by the government. The government “hires” members of congress, judges and military personnel. So, flows 1 through 4 are keeping track of when the government purcahses goods and services and resources to do what it does!
Flows 5 and 6 – Represent the flow of goods and services to households and businesses. Flows 7 and 8 – Represent the net taxes from businesses and households. I say net taxes because while both businesses and households pay taxes, they also receive funds from the government in the form of what are called transfer payments. I will elaborate on this more in a bit. Up to this point we have seen the government is part of the economy in terms of the circular flow. Next, let’s look at the federal government from the point of view expenditures and revenues.
The federal government has a budget each fiscal year. The fiscal year starts on Oct. 1 and runs through Sept. 31 of the following year. So, we are currently in the 2013 fiscal year. The two major types of outlays of the federal government are 1) government purchases and 2) transfer payments. Governemnt purchases are exhaustive. These purchases actually absorb resources such as land and labor and are part of the domestic output. Examples of government purchases are for military equipment and military personnel. Transfer payments are nonexhaustive. These outlays of the government do not directly absorb resources or create output. Examples of transfer payments are veterans’ benefits and social security benefits.
For the year 2009 the federal outlays totaled $3.522 trillion. 35% went to pensions and income security, 19% went to national defense, 22% went to health (medicare and medicaid), 5% went to interest on the public debt, and 19% went to all other government spending. Note: in a fiscal year if tax revenues are less than total outlays the government has a yearly deficit and the government has to borrow to make the outlays and that borrowing will be paid back with interest. All past deficits that have not been paid are accumulated into the public debt.
For the year 2009 the federal tax revenues totaled $2.105 trillion. 43% comes from personal income taxes, 42% comes from payroll taxes (your FICA – Federal Insurance Contributions Act – these taxes are the payments into social security and medicare), 7% comes from corporate income taxes, 3% comes from excise taxes (taxes on commodities or on purchases – like on gasoline), and 5% are from other sources like tariffs on items imported into the economy.
Final thought The federal government is large. There has been a great deal in the news lately about both the yearly deficits and the accumulated debt. On the next few slides I have some graphs of data taken from the Economic Report of the President 2012. The first graph has the yearly revenues and outlays of the federal government over time. The second graph has the difference between revenues and outlays.