The Simple Circular Flow
The Simple Circular Flow . The Simple Circular Flow . The Simple Circular Flow . The Simple Circular Flow . The Simple Circular Flow . Figure 8.1. The Simple Circular Flow. Two observations In every economic exchange, the seller receives exactly the same amount that the buyer spends.

The Simple Circular Flow
E N D
Presentation Transcript
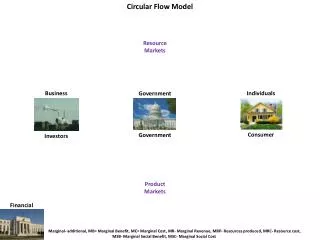
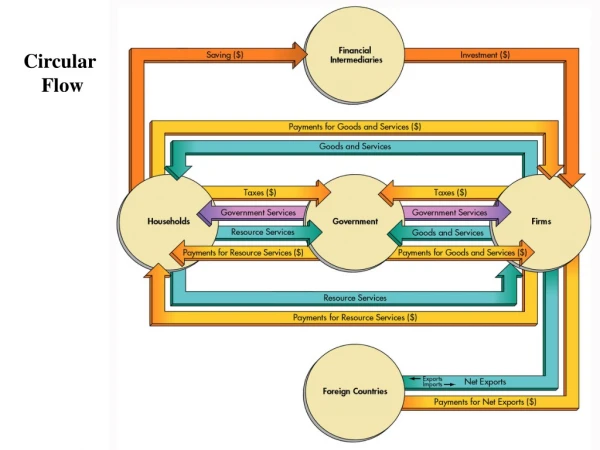
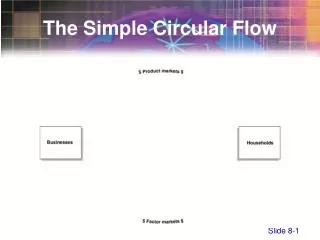
The Simple Circular Flow Figure 8.1
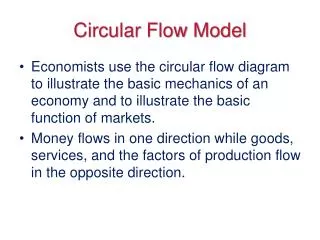
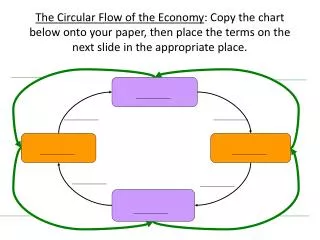
The Simple Circular Flow • Two observations • In every economic exchange, the seller receives exactly the same amount that the buyer spends. • Goods and services flow in one direction and money payments flow in the other.
The Simple Circular Flow • Profits explained • Question • Why is profit a cost of production? • Answer • Profits are the return entrepreneurs receive for the risk they incur when organizing productive activities
The Simple Circular Flow • Product Markets • Transactions in which households buy goods
The Simple Circular Flow • Final Goods and Services • Goods and services that are at their final stage of production and will not be transformed into yet other goods or services
The Simple Circular Flow • Factor Markets • Transactions in which businesses buy resources
The Simple Circular Flow • Total Income • The yearly amount earned by the nation’s factors of production
The Simple Circular Flow • Question • Why must total income be identical to the dollar value of total output? • Answer • Every transaction simultaneously involves an expenditure and a receipt
National Income Accounting • Gross Domestic Product (GDP) • The total market value of all final goods and services produced by factors of production located within a nation’s borders
National Income Accounting • Observations • GDP measures the dollar value of final output • GDP measures the dollar value of final goods and services produced per year by factors of production located within a nation’s borders
Two Main Methodsof Measuring GDP • Expenditure Approach • A way of computing national income by adding up the dollar value at current market prices of all final goods and services
Two Main Methodsof Measuring GDP Expenditure Approach
Two Main Methods of Measuring GDP • Income Approach • A way of measuring national income by adding up income received by all factors of production
Two Main Methodsof Measuring GDP Income Approach
Two Main Methodsof Measuring GDP • Deriving GDP by the expenditure approach • Consumption Expenditure (C) • Durables • Life span of more than three years • Nondurables • Life span of less than three years • Services • Intangible commodities
Two Main Methodsof Measuring GDP • Deriving GDP by the expenditure approach • Gross Private Domestic Investment (I) • The creation of capital goods, such as factories and machines, that can yield production and hence consumption in the future
Two Main Methodsof Measuring GDP • Deriving GDP by the expenditure approach • Gross Private Domestic Investment (I) • Fixed investment • Inventory investment • New residential structures
Two Main Methodsof Measuring GDP • Deriving GDP by the expenditure approach • Government Expenditures (G) • State, local, and federal • Valued at cost
Net exports (X) = total exports - total imports Two Main Methodsof Measuring GDP • Deriving GDP by the expenditure approach • Net Exports (Foreign Expenditures)
GDP = C + I + G + X Two Main Methodsof Measuring GDP • Mathematical representation using the expenditure approach
GDP and Its Components Figure 8-3
Two Main Methodsof Measuring GDP • Deriving GDP by the income approach
Deriving GDP by the Income Approach • Gross Domestic Income (GDI) • The sum of all income—wages, interest, rent, and profits—paid to the four factors of production
Two Main Methodsof Measuring GDP • Gross Domestic Income (GDI) • Wages • Interest • Rent • Profits
Gross Domestic Product and Gross Domestic Income, 2000(in billions of 2000 dollars per year) Figure 8-4 Source: U.S. Department of Commerce. First quarter preliminary data annualized.
Gross Domestic Product and Gross Domestic Income, 2000(in billions of 2000 dollars per year) Expenditure Point of View—Product Flow Expenditures by Different Sectors: Household sector Personal consumption expenses $6,661.5 Government sector Purchase of goods and services 1,734.6 Business sector Gross private domestic investment (including depreciation) 1,727.0 Foreign sector Net exports of goods and services -273.6 Gross Domestic Product $9,849.5
Gross Domestic Product and Gross Domestic Income, 2000(in billions of 2000 dollars per year) Income Point of View—Cost Flow Domestic Income (at factor cost): Wages All wages, salaries, and supplemental employee compensation $5,678.4 Rent All rental income of individuals plus implicit rent on owner-occupied dwellings 155.4 Interest Net interest paid by business 490.2 Profit Proprietorial income 701.3 Corporate profits before taxes deducted 952.0 Non-income expense items Indirect business taxes and other adjustments 762.1 Depreciation 1,215.4 Statistical discrepancy -105.3 Gross Domestic Income $9,849.5
Other Components of National Income Accounting • National Income (NI) • The total of all factor payments to resource owners • Personal Income (PI) • The amount of income that households actually receive before they pay personal income taxes
Other Components of National Income Accounting • Disposable Personal Income (DPI) • Personal income after personal income taxes have been paid
Going from GDP to Disposable Income, 2000 Billions of Dollars Gross domestic product (GDP) 9,849.5 Minus depreciation -1,215.4 Net domestic product (NDP) 8,634.1 Minus indirect business taxes -762.1 and other adjustments National Income (NI) 7,872.0 Minus corporate taxes, Social Security contributions, corporate retained earnings -1,236.5 Plus government and business transfer payments +1,606.8 Personal Income (PI) 8,242.3 Minus personal income tax and non-tax payments -1,253.2 Disposable personal income (DPI) 6,989.1 Source: U.S. Department of Commerce
Distinguishing Between Nominal and Real Values • Nominal Values • Measurements in terms of the actual market prices at which goods are sold; expressed in current dollars
Distinguishing Between Nominal and Real Values • Real Values • Measurements after adjustments have been made for changes in the average of prices between years; expressed in constant dollars
Real GDP = nominal GDP price level* = 100 *Price level: measured by the GDP deflator Distinguishing Between Nominal and Real Values • Correcting GDP for price index changes • Nominal (current) dollars GDP • Real (constant) dollars GDP
Correcting GDP for Price Changes (1) (2) (3) (4) = [(2)/(3)] x 100 Nominal GDP Real GDP (billions of (billions of dollars dollars Price Level Index per year Year per year) (base year 1992 = 100) in constant 1992 dollars) 1990 5,803.2 86.8 6,683.5 1991 5,986.2 89.8 6,669.2 1992 6,318.9 91.7 6,891.1 1993 6,642.3 94.2 7,054.1 1994 7,054.3 96.1 7,337.8 1995 7,400.5 98.2 7,537.1 1996 7,813.2 100.0 7,813.2 1997 8,300.9 101.7 8,165.1 1998 8,759.9 102.9 8,516.3 1999 9,254.6 104.4 8,867.0 2000 9,849.5 106.4 9,256.2 Source: U.S. Department of Commerce, Bureau of Economic Analysis
Distinguishing Between Nominal and Real Values • Example • Base Year = 1992 • Price Index = 100
nominal GDP price index = 100 Real 1992 GDP = $6,020.2 100 = 100 = $6,020.2 billion Real 1992 GDP = Distinguishing Between Nominal and Real Values Real GDP = nominal GDPin the base year
$6,343.3 102.2 = 100 = $6,206.8 billion Real 1993 GDP = Distinguishing Between Nominal and Real Values • 1993 • Price Index = 102.2
$4,539.9 82.7 = 100 = $5,489.6 billion Real 1993 GDP = Distinguishing Between Nominal and Real Values • 1987 • Price Index = 82.7
Nominal and Real GDP Figure 8-5 Source: U.S. Department of Commerce
real GDP population Per capita real GDP = Distinguishing Between Nominal and Real Values • Per capita GDP • Adjusting for population growth
Distinguishing Between Nominal and Real Values • Question • Is real per capita GDP a good indicator of social well-being?
Distinguishing Between Nominal and Real Values • Some issues • The distribution of output • Changes in leisure time • Increased traffic congestion • Air pollution • Crime • Housework
Issues and Applications:How Well Do Economists Predict GDP? • Forecasting economists have done a relatively good job predicting long-run trends in real GDP. • They have not done as well predicting recessions.
Economic Forecasts:Missing the Mark Forecasted Growth Actual Growth Start of Recession Date of Forecast over the Next Year (%) in Real GDP (%) December 1969 December 1969 1.5 -.6 November 1973 December 1973 1.5 -1.8 January 1980 December 1979 -.7 -.3 July 1990 December 1989 2.1 -.1 July 1991 December 1990 2.2 .7 Source: Business Week, September 30, 1992, p. 92
How Well Do Economists Predict GDP? • Difficulties in predicting downturns • Trying to develop computer models for a changing multi-trillion dollar economy • Globalization • Data sources and methodology