Download
1 / 64
640 likes | 914 Views
Careers for a New Economy November 21, 2008 . Understand your industry Residential Energy Efficiency (EE) Commercial and Industrial EE Wind Power Solar Photovoltaic Power Solar Thermal Geothermal Biofuels Biomass High Performance Green Building Carbon Management .

E N D
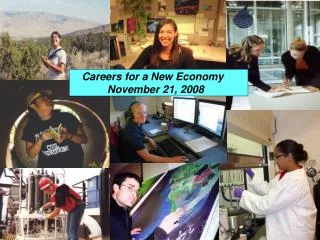
Careers for a New Economy November 21, 2008
Understand your industry • Residential Energy Efficiency (EE) • Commercial and Industrial EE • Wind Power • Solar Photovoltaic Power • Solar Thermal • Geothermal • Biofuels • Biomass • High Performance Green Building • Carbon Management • Clarify your motivations • Values • Dreams • Personality Type • Goals • Strengths and Weaknesses • Financial needs/desires • Improve career search skills • Career Information Gathering • Networking • Job search • Resumes and Cover Letters • Interviewing Develop your skill set Technical Scientific Engineering Leadership/Management Communication Business Functions
A quick look at the history of green careers • (1850s-1890) Preservation movement - romantic inspiration of wild lands • (1890s-1950s) Management movement – long-term thinking about natural resources • (1950s-1970) Ecological movement – rise of scientific ecological understanding • (1970s-1990s) Regulatorymovement – pollution control and prevention environmental policies • (1990s-now) Sustainable ecosystems movement – integrating ecosystem conservation strategies with social justice and economic security concerns.
Green public servants find the sustainability “sweet spot” in problems and opportunities
Eight megatrends changing your world Population 1930: 2 billion 1960: 3 billion 1974: 4 billion 1987: 5 billion 1998: 6 billion 2009: 7 billion 2050: 9.2 billion
Megatrends Rising living standards and expectations An integrated global economy The rising power of China and India The world’s people are moving to cities The end of cheap oil Technological progress is staggering Gap between rich and poor is rising Warfare as conflict management is not declining Global ecosystems are under siege
Who employs “green” professionals and workers? Federal government State government Local government Not-for-profit organizations Academia Green businesses/departments in all industries “EHS” departments in “brown” businesses The traditional “environmental” industry
Exploring Industry Structures Online • Green Biz http://www.greenbiz.com • New England Clean Energy Council http://www.necec.org • American Wind Energy Association http://www.awea.org • Solar Energy Business Association of New England http://www.sebane.org • American Solar Energy Society http://www.ases.org • Massachusetts Renewable Energy Trust http://www.masstech.org
Ten Skills “Green” Employers Want Applicants to Have • Communication skills • Collaboration abilities – team orientation • “Customer” orientation • Creativity, innovative thinking • Broad environmental sciences understanding • Analytical ability, critical thinking, problem-solving • Work orientation, professionalism, positive attitude • Occupation-specific skills and knowledge • Mastery of information technology, including GIS • Leadership ability Source: USEPA Workforce Assessment Project
Solar Power and Photovoltaic Systems Solar Development/Manufacturing Jobs Solar Fabrication Technician Solar Lab Technician Solar Hot Water Heater Manufacturing Technician PV Fabrication and Testing Technician
Solar Power and Photovoltaic Systems Solar Installation and Maintenance Solar Energy System Installer Helper Solar Energy System Installer Solar and PV Installation: Roofer Solar Residential Installation Electrician Solar Commercial Installation Electrician ICE Technician Solar Commercial Installation Engineering Tech Solar Residential Installation Electrician Foreman Solar Commercial Installation Electrician Foreman Solar Commercial Installation Engineer
Solar Power and Photovoltaic Systems Solar Engineering/Design/Project Mgmt. Solar Energy Systems Designer Solar Thermoelectric Plant Manager Solar Operations Engineer PV Solar Cell Designer Solar Energy Engineer PV Power Systems Engineer
Wind Power Wind Development and Manufacturing Wind Turbine Machinist Wind Turbine Sheet Metal Worker Wind Turbine Engineering Intern Wind Farm Electrical Systems Designer Wind Turbine Electrical Engineer Wind Turbine Mechanical Engineer
Wind Power Wind Power Installation/Maintenance Wind Power Technician Junior Renewable Energy Technician Wind Generating Installer Electro-Mechanical Wind Turbine Technician Wind Field Operations Manager – Commercial Wind Field Service Technician Engineering, Design, Project Management Wind Power Plant Project Engineer Director of Wind Development
Geothermal Power Power Plant Development/Manufacturing Geothermal Heat Pump Machinist Geothermal Sheet Metal Worker Geothermal Engineering Intern Geothermal Electrical Engineer Geothermal Power Generation Engineer (Mechanical)
Geothermal Power Geothermal Installation/Maintenance Geothermal Plant Installation Technician Geothermal Plant Efficiency Operator Geothermal Operations Engineer
Geothermal Power Geothermal Engineering, Design andProject Management Geothermal Engineering Intern Hydrogeologist Geothermal Mechanical Engineer Geothermal Electrical Engineer Geothermal Power Plant Structural Engineer
Biogas/Biomethane Generated Power Landfill Gas Collection Operations Landfill Gas Collection System Operator Landfill Gas System Technician
U.S. Energy Mix • Oil 39% • Natural Gas 24% • Coal 23% • Nuclear 8% • Hydro 3% • Other Renewable 3% Fossil Fuel
Asking a new question Old question: How can we assure a stable, cheap supply of oil, natural gas and coal? Recent question: How can we reduce as much as possible the negative ecological and health consequences of fossil fuel dependence? New question: How can we rapidly move to an ecologically sustainable future that dramatically reduces, or even eliminates, the use of fossil fuels as a major energy source?
Climate Change Career Directions Improving Basic Scientific Understanding Energy Efficiency Improvements Expanding Non-Fossil Fuel Energy Sources Lowering the Climate Change Impact of Fossil Fuels Energy Management/Climate Change Planning Community Planning and Design Deforestation and Reforestation Strategies Agricultural Changes Policy Development Communication, Public Relations, Education Monitoring and Measurement Finance and Investment Activity Response and Mitigation Work Carbon Capture and Sequestration
Utility Energy Efficiency and ESCOs Projecting Significant Growth Near-term forecast (2006-08) Utility EE programs expected to grow by at least 15%/year ESCO revenues projected to increase by 22% per year Utility Energy Efficiency Program Budgets • Greatly increased need for experienced professionals and technicians to provide energy efficiency services ESCO Industry Activity Sources: CEE, Hopper & Goldman, LBNL survey 2007
Clean Energy Market to Hit $254 Billion by 2017, Says Study OAKLAND, March 11, 2008 – Global clean-energy markets are expanding rapidly,according to a new study. According to Clean Energy Trends 2008, revenues in four benchmark sectors (biofuels, wind power, solar photovoltaics, and fuel cells) are up 40% in a year, to $77.3 billion in 2007. The report describes how: * small start-ups are powering markets for electric vehicles; * sustainable cities are being designed and built from the ground up; * overseas players are powering the U.S. wind market boom; * geothermal energy is experiencing a global renaissance. In the United States, venture capitalists invested $2.7 billion in the clean energy sector, 10% of total venture capital activity.
Clean Energy Projected Growth 2006-2016 ($US Billions)
Growth of the U.S. Green Building Council Indicator20012008 Accredited professionals 527 50,000+ Member companies/orgs 1,137 10,000+ Local chapters 15 150+ Square feet registered or certified as “green”: 867 million Building projects registered or certified: 6,297 Size of green building market in 2007: $12 billion
Continued Rapid Growth for Organic Food • Annual U.S. growth of 16-21% from 1997-2004 • U.S. organic food sales were $12 billion • Four million “organic” acres in North America • 10-15% annual growth expected 2006-2010 • 5-10% growth projected for 2011-2025 • 2025 organic sales projected at $50 billion. This would still be only 6% of total U.S. food sales.
A market for carbon? It’s already here. • Chicago Climate Exchange: 500+ members in 6 years • Global carbon credit trading doubled from ’07 to ’08 • 2008 trading was more than $60 billion worldwide • Leader: European Union Emissions Trading Scheme • On the rise: State of California, Regional Schemes • Dozens of carbon “offset” companies have begun
United Nations Priorities • Water and sanitation • Energy (supply and cleanliness) • Agricultural productivity • Biodiversity protection • Human health impacts • Climate change • Global environmental monitoring • Policy integration
Environmental Science Priorities • Climate variability • Biogeochemical cycles • Biodiversity and ecosystem functioning • Hydrologic forecasting • Infectious diseases and the environment • Institutions and resource use • Land use dynamics • Re-inventing the use of materials
Environmental “Industry”* Employment: 2007 SegmentRevenueEntitiesEmployment Analytical Services $ 1.8 billion 1,110 20,000 Wastewater Works $35.6 26,000 141,000 Solid Waste Mgmt. $47.8 10,450 256,500 HazWaste Mgmt. $ 8.4 680 43,700 Remediation $10.8 2,300 94,500 Consulting/Engineer* $22.4 3,650 220,800 Equip/Chems/Instrum. $59.7 6,200 410,900 Water Utilities $35.1 61,400 145,200 Resource Recovery $20.8 4,700 155,100 Clean Energy Systems $22.3 1,300 100,400 -------------- ------------ ------------- $264.6 billion 117,790* 1,588,200 * ~30,000 private companies, ~88,000 public or quasi-public agencies
Selected Federal Government Employment 2007 AgencyPermNonPermTotalHiresSeparations Forest Service 29,873 9,03938,948 14,658 16,325 NRCS 12,158 335 12,493 957 1,388 Land Managm’t 9,591 1,795 11,386 2,979 3,159 Reclamation 5,498 196 5,694 547 721 Geo. Survey 7,607 1,212 8,819 1,012 1,397 Park Service 15,901 6,357 22,258 8,282 9,001 Fish & Wildlife 8,213 1,039 9,252 1,225 1,417 Energy 14,523 426 14,950 1,312 1,271 Int’l Development 1,766 645 2,413 189 200 Environ. Protect. 17,097 1,146 18,248 1,180 1,139 NASA 17,229 1,225 18,457 963 1,187 Food & Drug 8,298 2,992 11,315 762 749 Nat’l Inst. Health 14,324 3,393 17,733 2,192 1,432 Disease Control 6,847 903 7,768 485 407 ---------- 199,734
Local and State Government Employment: 2007 Department State Gov’tLocalTotal Highways 240,300 306,904 547,204 Public Health 189,054 250,163 439,217 Solid Waste 1,930 107,506 109,436 Sewerage 1,769 125,795 127,564 Parks & Recreation 39,170 233,213 272,383 Community Develop. ? 114,100 114,100 Natural Resources 161,481 41,715 203,196 Water Supply 711 165,221 165,932 Electric Power 4,055 73,580 77,635 Transit 33,201 195,656 228,945 K-12 Instruction (10%) 4,132 458,000 462,132 High Ed Instruction (10%) 76,500 13,500 90,000 Other 21,000 10,000 31,000 ------------ ------------ ----------- Total 773,394 2,095,356 2,868,747
International eco-investments soaring Sector2007 $ (Bil)2010 $ (Bil) United States 270 300 Other Developed 330 350 Developing 100 130 ----- ----- Total 700780
What environmental employers say to me • You can’t really trust our job descriptions. • We want to know what students can do and have done. • We overvalue internships and undervalue coursework. • Line managers overvalue technical skills. Senior managers overvalue people/leadership skills. • There’s not as much teamwork as we say there is. • There are huge discrepancies in our levels of technology. • We think in project completion, not “tasks/responsibilities”. • We talk long term. We hire for immediate needs. • The sustainability paradigm hasn’t really taken hold yet. • Networking is more important than ever. • “Writing with visuals” is overtaking traditional reports. • We can’t promote people as quickly as we want to.
Trend: We need more eco-professionals February 2008 data analysis shows that there is still a steady demand in traditional “environmental” professions. Foresters, fish and wildlife biologists, air and water quality specialists, land use planners, eco-lawyers? We still need you!
Environmental Careers Salary Report 2008 Take a look at current employment trends in some of the best-known eco-professions. Employment growth outlook is described on scale where: Excellent = Much faster than the average of the overall economy Good = Faster than than the average Steady = About as fast as the average Slow = Slower than the average Poor = Much slower than the average
Social Scientists Total = 20,000 Does not include teachers and college professors Outlook = Steady Anthropologists & Archaeologists: $47,402 Geographers: $63,690 Historian: $48,050 Political Scientists: $91,085 Sociologists: $62,502 Entry BA: $30,000 Entry MA: $44,200 Entry PhD: $48,200
Environmental Lawyers Total = ~ 79,400 60% in private industry Outlook = Steady Entry Level Pay: Public Interest $40,000 Median: $103,130 Government $46,000 Middle 50% = $69,820-$155,108 Business/Industry $71,000 Private practice $86,400 Median for all: $60,000
Urban & Regional Planners Total = 34,000 Does not include teachers and college professors Outlook = Steady Median = $57,560 Low 10% = $36,442< Middle 50% = $45,176-$72,722 High 10% = >$88,962 70% of urban and regional planners work in local government Median salary of local government planners = $57,938
Environmental Scientists Total currently employed = 76,000 Total does notinclude teachers and college professors! Outlook: Steady Employer medians Median = $55,000 Federal: $79,184 Low 10% = $33,210< Local: $52,628 Middle 50% = $42,106-72,539 State: $50,452 High 10% = >$101,723 Private: $56,000 Starting salaries average for recent BS grads: ~$34,000 44% are at local and state government agencies 8% federal government agencies 14% architecture and engineering firms 15% management, scientific and technical consulting 4% other private employers 5% are self employed
Conservation Scientists/Foresters Total = 33,959 Total does not include teachers and college professors Outlook: Slow Conservation ScientistsForesters Median = $56,515 $51,938 Low 10% = $<33,104 $32,059< Middle 50% = $42,709-$70,590 $40,125-65,152 High 10% = >$84,504 >$77,590 33% work with federal government 21% state government 11% local government 35% private industry and consulting firms Starting salaries with BS degrees average ~ $26,000-$32,100 With an MS average ~ $39,300 - $47,500 With a PhD ~ $57,000
Environmental Engineers Total = 54,000 Outlook = Excellent Median = $71,800 Low 10% = $43,868< Low 25% = $54,796 High 25% = $90,386 High 10% = >$108,050 Entry (BS) = $50,702