Download
1 / 20
200 likes | 358 Views
Spatial Modeling of Whitebark Pine in Three Rocky Mountain Ecosystems. FEScUE Program, Summer 2009. Whitebark Pine. Whitebark pine ( Pinus albicaulis ) is a keystone subalpine species of the family Pinaceae, subgenus Strobus. Pathogen Cronartium ribicola

E N D
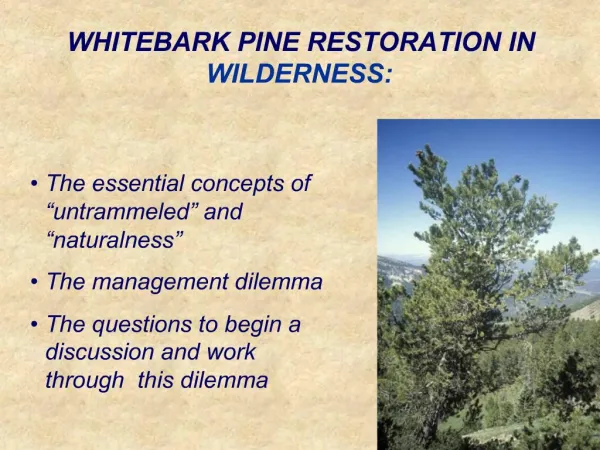
Spatial Modeling of Whitebark Pine in Three Rocky Mountain Ecosystems FEScUE Program, Summer 2009
Whitebark Pine • Whitebark pine (Pinus albicaulis) is a keystone subalpine species of the family Pinaceae, subgenus Strobus.
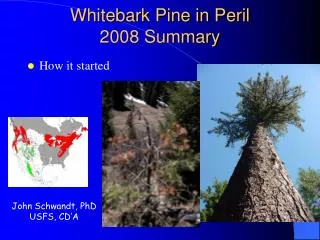
Pathogen Cronartium ribicola Originated in Asia, infected seedlings were shipped over Infection spread across the Northern Rocky Mountain region Kills cone-bearing branches and trees Mortality reaches 90% or higher Rust-resistant alleles-1 to 5% Main areas of interest: Bitterroot Mountain Ecosystem, the Northern Divide, the Greater Yellowstone Ecosystem White Pine Blister Rust?
Initially yellow spots on needles Yellow to orange swellings on branches and trunk Rupture and produce orange-yellow spores Symptoms appear in late summer, early fall Swellings rupture in early or mid spring and disappear until the next year Symptoms
What and Why in WPBR? • WPBR affects mutualism between the Clark’s Nutcracker and the White Pine • How does density affect WPBR? • What are the effects of genetics? • What would a model based on individuals look like? • What is the variance? • Does restoration really make a big enough difference?
Our plan of action… ABMs ABM: Agent Based Models Tracks specific trees through time. See total population structure as a result. 3 existing models. 1 working with genetics 1 ‘in the shop’ with genetics and density 1 working with genetics, dd, Visio-spatial
Why ABMs? Cons • Takes time to run • Not as intuitive as good ol’ Leslie • Harder to code • Hard to debug • Pros • Statistical approach • Gives multiple samples • Motivates more ?’s • Cooler graphs
S&D: How it works • Tracking the first seedling • Tracking event • Survives? • Grows? • Becomes infected? • Probabilities derived from STU’s data • Independent events: Pr(AandB)=Pr(A)Pr(B)
S&D: How it works • What events take place? grows Stays the same Grows & gets infected
S&D: How it works • Let’s do this for an entire forest! Luckily, Matlab has 3D matrices
S&D: How it works Bringin’ it all back Home, We sum the z components…
¡Genetics! • Why incorporate genetics? • to monitor resistance in the population • to see the effects of infection on resistance • vice versa rr RR Rr
The How Made one 36x36 projection matrix with a 12x12 portion for each genotype. triplicate Altered the projection matrix for resistance condense multiply By M Similarly changed the state vector to a 36x1
Spatially Explicit Modeling • A 1-ha square within a research site
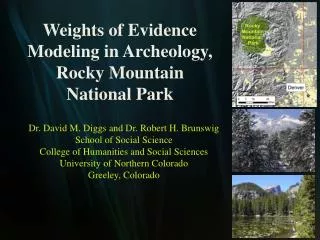
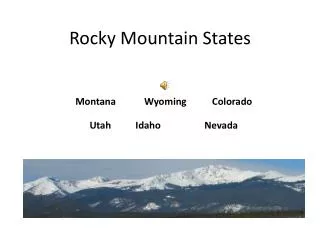
Whitebark Pine Range • Multiple research sites were established within three distinct ecosystems in the Central and Northern Rocky Mountains, USA: • The Northern Divide Ecosystem in northwestern Montana • The Bitterroot Mountain Ecosystem in west-central Montana and east-central Idaho • The Greater Yellowstone Ecosystem in southwestern Montana and northwestern Wyoming.
The Northern Divide Ecosystem • Among ecosystems, cone production and nutcracker occurrence were lowest in the Northern Divide. • Nutcrackers failed to be observed in 80% of the Northern Divide site-years.
The Bitterroot Mountains Ecosystem • Nutcrackers failed to be observed in 40% of site-years in the Bitterroot Mountains.
The Greater Yellowstone Ecosystem • Among ecosystems, cone production and nutcracker occurrence were highest in the Greater Yellowstone. • Nutcrackers were present and dispersing seeds in all years in the Greater Yellowstone Ecosystem.