Download
1 / 45
450 likes | 575 Views
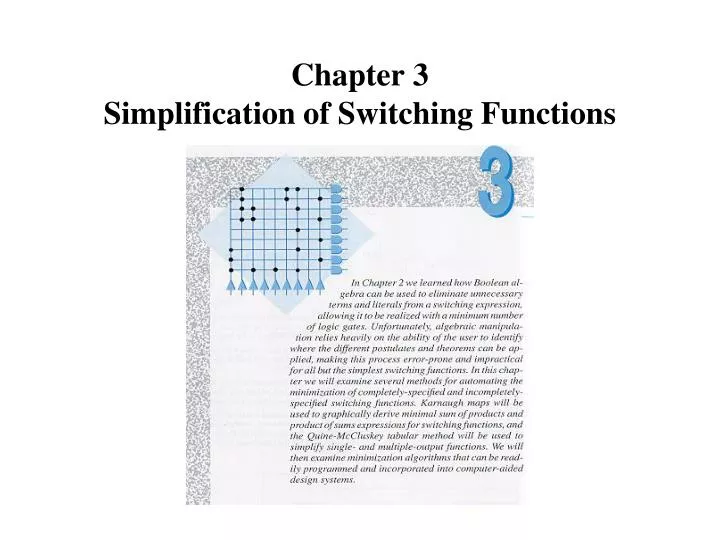
Chapter 3 Simplification of Switching Functions. Simplification Goals. Goal -- minimize the cost of realizing a switching function Cost measures and other considerations Number of gates Number of levels Gate fan in and/or fan out Interconnection complexity Preventing hazards

E N D
Simplification Goals • Goal -- minimize the cost of realizing a switching function • Cost measures and other considerations • Number of gates • Number of levels • Gate fan in and/or fan out • Interconnection complexity • Preventing hazards • Two-level realizations • Minimize the number of gates (terms in switching function) • Minimize the fan in (literals in switching function)
Example 3.1 Determine the form and the number of terms and literals in each of the following. g(A,B,C) = AB + A B + AC Two-level form, three products , two sums, six literals. -------------------- f(X,Y,Z) = X Y(Z + Y X) + Y Z Four-level form, four products, two sums, seven literals.
Minimization Methods • Commonly used techniques • Boolean algebra postulates and theorems • Karnaugh maps • Quine-McCluskey method • Petrick’s method • Generalized concensus algorithm • Characteristics • Heuristics (suboptimal) • Algorithms (optimal)
Minimum SOP and POS Representations • The minimum sum of products (MSOP) of a function, f, is a SOP representation of f that contains the fewest number of product terms and fewest number of literals of any SOP representation of f. • Example -- f(a,b,c,d) = m(3,7,11,12,13,14,15) = ab + acd + acd = ab + cd • The minimum product of sums (MPOS) of a function, f, is a POS representation of f that contains the fewest number of sum terms and the fewest number of literals of any POS representation of f. • Example -- f(a,b,c,d) = M(0,1,2,4,5,6,8,9,10) = (a + c)(a + d)(a + b + d)(b + c + d) = (a +c)(a + d)(b + c)(b + d)
Karnaugh Maps • Karnaugh maps (K-maps) -- convenient tool for representing switching functions of up to six variables. • K-maps form the basis of useful heuristics for finding MSOP and MPOS representations. • An n-variable K-map has 2n cells with each cell corresponding to a row of an n-variable truth table. • K-map cells are labeled with the corresponding truth-table row. • K-map cells are arranged such that adjacent cells correspond to truth rows that differ in only one bit position (logical adjacency). • Switching functions are mapped (or plotted) by placing the function’s value (0,1,d) in each cell of the map.
Figure 3.1 Venn diagram and equivalent K-mapfor two variables
Figure 3.2 Venn diagram and equivalent K-mapfor three variables
Plotting (Mapping) Functions in Canonical Form on a K-map • Let f be a switching function of n variables where n 6. • Assume that the cells of the K-map are numbered from 0 to 2n where the numbers correspond to the rows of the truth table of f. • If miis a minterm of f, then place a 1 in cell i of the K-map. • Example -- f(A,B,C) = m(0,3,5) • If Mi is a maxterm of f, then place a 0 in cell i. • Example -- f(A,B,C) = M(1,2,4,6,7) • If diis a don’t care of f, then place a d in cell i.
Figure 3.4 Plotting functions on K-maps f(A,B,C) = m(0,3,5) = M(1,2,4,6,7)
Figure 3.5 K-maps for f(a,b,Q,G) in Example 3.4(a) Minterm form. (b) Maxterm form. f(a,b,Q,G) = m(0,3,5,7,10,11,12,13,14,15) = M(1,2,4,6,8,9)
Figure 3.6 K-map of Figure 3.5(a) with variables reordered: f(Q,G,b,a). f(Q,G,b,a) = m(0,12,6,14,9,13,3,7,11,15) = m(0,3,6,7,9,11,12,13,14,15)
Plotting Functions in Algebraic Form • Example 3.6 -- f(A,B,C) = AB + BC • Example 3.7 -- f(A,B,C,D) = (A + C)(B + C)(B + C + D) • Example 3.8 --f(A,B,C,D)= (A+B)(A+C+D)(B+C+D)
Figure 3.7 -- Example 3.6.(a) Venn diagram form. (b) Sum of minterms. (c) Maxterms. f(A,B,C) = AB + BC
Figure 3.8 -- Example 3.7.(a) Maxterms, (b) Minterms, (c) Minterms of f . f(A,B,C,D) = (A + C)(B + C)(B + C + D)
Figure 3.9 -- Example 3.8.(a) K-map of f, (b) K-map of f. f(A,B,C,D)= (A+B)(A+C+D)(B+C+D)
Simplification of Switching FunctionsUsing K-maps • K-map cells that are physically adjacent are also logically adjacent. Also, cells on an edge of a K-map are logically adjacent to cells on the opposite edge of the map. • If two logically adjacent cells both contain logical 1s, the two cells can be combined to eliminate the variable that has value 1 in one cell’s label and value 0 in the other. • This is equivalent to the algebraic operation, aP + aP =P where P is a product term not containing a or a. • Example -- f(A,B,C,D) = m(1,2,4,6,9)
Figure 3.10 K-map for Example 3.9 f(A,B,C,D) = m(1,2,4,6,9)
Simplification Guidelines for K-maps • Each cell of an n-variable K-map has n logically adjacent cells. • Cells may be combined in groups of 2,4,8,…,2k. • A group of cells can be combined only if all cells in the group have the same value for some set of variables. • Always combine as many cells in a group as possible. This will result in the fewest number of literals in the term that represents the group. • Make as few groupings as possible to cover all minterms. This will result in the fewest product terms. • Always begin with the “loneliest” cells.
Prime Implicants and Covers • An implicant is a product term that can cover minterms of a function. • A prime implicant is a product term that is not covered by another implicant of the function. • An essential prime implicant is a prime implicant that covers at least one minterm that is not covered by any other prime implicant. • A set of implicants is said to be a cover of a function if each minterm of the function is covered by at least one implicant in the set. • A minimal cover is a cover that contains the smallest number of prime implicants and the smallest number of literals..
Figure 3.11 K-map illustrating implicants Minterms: {AB C, A BC, A BC, ABC, ABC} Groups of two minterms: {A B, AB, A C, BC, BC} Groups of four minterms: {B} Prime implicants: {A C, B} Cover = {A C, B} MSOP = A C + B
Algorithm 3.1 -- Generating and SelectingPrime Implicants 1. Count the number of adjacencies for each minterm on the K-map. 2. Select an uncovered minterm with the fewest number of adjacencies. Make an arbitrary choice if more than one choice is possible. 3. Generate a prime implicant for this minterm and put it in the cover. If this minterm is covered by more than one prime implicant, select the one that covers the most uncovered minterms. 4. Repeat steps 2 and 3 until all minterms have been covered.
Figure 3.12 -- Example 3.10(Illustrating Algorithm 3.1) f(A,B,C,D) = m(2,3,4,5,7,8,10,13,15)
Algorithm 3.2 -- Generating and SelectingPrime Implicants (Revisited) 1. Circle all prime implicants on the K-map. 2. Identify and select all essential prime implicants for the cover. 3. Select a minimum subset of the remaining prime implicants to complete the cover, that is, to cover those minterms not covered by the essential prime implicants.
Figure 3.13 -- Example 3.11(Illustrates Algorithm 3.2) f(A,B,C,D) = m(2,3,4,5,7,8,10,13,15)
Figure 3.14 -- Example 3.12f(A,B,C,D) = m(0,5,7,8,10,12,14,15)
Figure 3.15 -- Example 3.13f(A,B,C,D) = m(1,2,3,6) = AC + BC
Figure 3.17 -- Example 3.15Function with no essential prime implicants. f(A,B,C,D) = m(0,4,5,7,8,10,14,15)
Figure 3.18 -- Example 3.16Minimizing a five-variable function.f(A,B,C,D,E) = m(0,2,4,7,10,12,13,18,23,26,28,29)
Prime Implicates and Covers • A implicate is a sum term that can cover maxterms of a function. • A prime implicate is a sum term that is not covered by another implicate of the function. • An essential prime implicate is a prime implicate that covers at least one maxterm that is not covered by any other prime implicate. • A set of implicate is said to be a cover of a function if each maxterm of the function is covered by at least one implicate in the set. • A minimal cover is a cover that contains the smallest number of prime implicate and the smallest number of literals..
Algorithm 3.3 -- Generating and SelectingPrime Implicates 1. Count the number of adjacencies for each maxterm on the K-map. 2. Select an uncovered maxterm with the fewest number of adjacencies. Make an arbitrary choice if more than one choice is possible. 3. Generate a prime implicate for this maxterm and put it in the cover. If this maxterm is covered by more than one prime implicate, select the one that covers the most uncovered maxterms. 4. Repeat steps 2 and 3 until all maxterms have been covered.
Algorithm 3.4 -- Generating and SelectingPrime Implicates (Revisited) 1. Circle all prime implicates on the K-map. 2. Identify and select all essential prime implicates for the cover. 3. Select a minimum subset of the remaining prime implicates to complete the cover, that is, to cover those maxterms not covered by the essential prime implicates.
Example 3.17 -- Find the minimum POS form of the functionf(A,B,C,D) = M(0,1,2,3,6,9,14) Figure 3.19 K-maps for Example 3.17.
Algorithm 3.5 -- Finding MPOS of f from f 1. Plot the complement function f on the K-map. 2. Use algorithm 3.1 or 3.2 to produce a MSOP of f. 3. Complement f and use DeMorgan’s theorem to produce a MSOP of f.
Example 3.18 -- Find the MPOS of the following function using Algorithm 3.5f(A,B,C,D) = M(0,1,2,3,6,9,14) Figure 3.20 K-map of f f = A B + B C D + BCD f = (A + B)(B + C + D )(B + C + D)
Example 3.19 -- Minimum covers off(A,B,C,D) = M (3,4,6,8,9,11,12,14) and its complement. Figure 3.21
Figure 3.22 Finding a minimal POS expressionfor a 5-variable function.
Example 3.22 -- Minimizing a Function with Don’t Cares.f(A,B,C,D) = m(1,3,4,7,11) + d(5,12,13,14,15)= M(0,2,6,8,9,10) D(5,12,13,14,15) SOP POS Figure 3.24 K-maps for Example 3.22.
Example 3.23 -- Design a circuit to distinguish BCD digits 5 from those 5. Figure 3.25 -- block diagram and truth table.
Example 3.23 (concluded) MSOP MPOS Figure 3.26 Use of don’t cares for SOP and POS forms. f(A,B,C,D) = A + BD + BC; f(A,B,C,D) = (A + B)(A + C + D)
Timing Hazards in Combinational Logic Circuits • Hazards are undesirable changes in the output of a combinational logic circuit caused by unequal gate propagation delays. • Static hazard (glitch) -- the output momentarily changes from the correct or static state • Static 1 hazard -- the output changes from 1 to 0 and back to 1 • Static 0 hazard -- the output changes from 0 to 1 and back to 0 • Dynamic hazard (bounce) -- the output changes multiple times during a change of state • Dynamic 0 to 1 hazard -- the output changes from 0 to 1 to 0 to 1 • Dynamic 1 to 0 hazard -- the output changes from 1 to 0 to 1 to 0