Download
1 / 14
140 likes | 236 Views
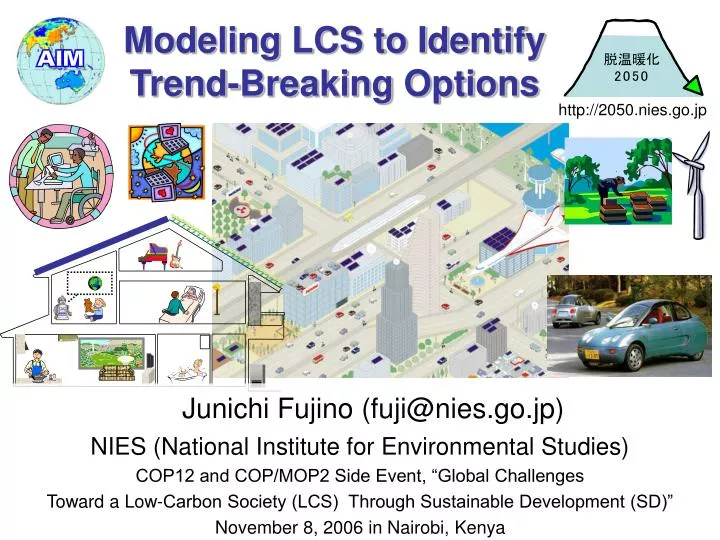
Modeling LCS to Identify Trend-Breaking Options. http://2050.nies.go.jp. Junichi Fujino (fuji@nies.go.jp) NIES (National Institute for Environmental Studies) COP12 and COP/MOP2 Side Event, “Global Challenges Toward a Low-Carbon Society (LCS) Through Sustainable Development (SD)”

E N D
Modeling LCS to Identify Trend-Breaking Options http://2050.nies.go.jp Junichi Fujino (fuji@nies.go.jp) NIES (National Institute for Environmental Studies) COP12 and COP/MOP2 Side Event, “Global Challenges Toward a Low-Carbon Society (LCS) Through Sustainable Development (SD)” November 8, 2006 in Nairobi, Kenya
1978 Himalayan Glaciers North Pole Ice in Sep. 1998 Source: NASA
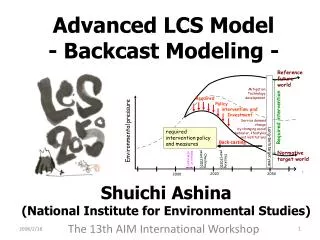
Back-casting from future target world Technology development, socio-economic change projected by historically trend Reference future world Forecasting Mitigation Technology development 3. We need “Trend Breaks” to realize visions Required Policy intervention and Investment Required intervention Service demand change by changing social behavior, lifestyles and institutions Environmental pressure required intervention policy and measures 2. We need “Visions” Back-casting Long-term target year 1.Target may be tough Normative target world Checking year(2015) Checking year(2025) Release of AIM result 50% reductions In the world 2020 2050 2000
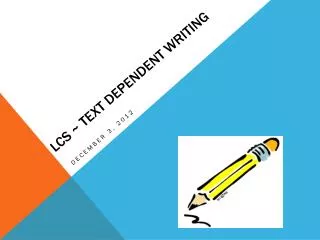
As for LCS visions, we prepared two different but likely future societies Akemi Imagawa 2. We need “Visions”
Depict Future Image: Residential sector in 2050 PV on roof LED light 3-4kW 66% reduction of lighting demand Heat insulation house 60% reduction of heat demand Super high efficiency air-conditioner COP=8 for cooling Fuel cell cogeneration Environment Education HEMS (Home Energy Management System) Stand-by energy reduction Hot water supply by heat pump or solar heating Eco-life Navigation 33% reduction 10-20% reduction COP=5 for warming 10-20% reduction Infrastructure Efficient use 3. We need “Trend Breaks” New energy Eco-lifestyle
Top Runner Program: Efficiency Improvement -The “Top Runner Program” has -stimulated competition and innovation in the market, -diffused existing technologies, and -enhanced industrial competitiveness -It created “win-win” situation and virtuous cycle. Fig: Energy efficiency of refrigerator (Source) JEMA (2002) 3. We need “Trend Breaks”
MOE AIST METI METI Projected energy efficiency improvement: Air-conditioners for cooling and heating 9.0 8.0 Historical 7.0 Best 6.0 5.0 COP (Coefficient of performance) 4.0 Average 3.0 Worst 2.0 1.0 3. We need “Trend Breaks” 0.0 1995 2000 2005 2010 2015 2020 2025 2030 2035 2040 2045 2050 2055
Check consistency! AIM (Asia-Pacific Integrated Model) for Japan LCS scenarios
Number of Dwelling by type Population by age 140 120 80- 100 60-79 80 40-59 Population (Thousand) 20-39 60 0-19 40 20 0 2000 2010 2020 2030 2040 2050 Transportation demand by mode
Possible trend-breaking options to achieve 70% reductions toward 2050 in Japan (Scenario A) amount amount* Service Demand (SD) 40 23MtC Demand side 27MtC 16MtC Energy Efficiency (EE) 78 8MtC 21MtC 11MtC 9MtC 30MtC Supply side Carbon Intensity (CI) 79 11MtC 41MtC CCS 30 30MtC * CO2 reduction amount compared with the emissions in 2000 CCS: Carbon Capture Storage
¢ ¢ D D D D D C D ( E / D ) ( C / E ) ( C / C ) = + + + + Cross ¢ ¢ C D ( E / D ) ( C / E ) ( C / C ) Factor decomposition of CO2 emission reduction in 2050 Japan using Kaya Identity C:CO2 emissions D:Activity E:Energy demand C’:CO2 emissions (excluding energy conversion sector) 0% -20% -40% -60% -80% Service demand improvement -4% 2050 A 2050 B D -11% Energy efficiency improvement in end-use sectors -30% E/D -18% vs 2000's Fuel mix change in end-use sectors -7% C'/E -30% -28% Fuel mix change in Energy conversion C/C' -14% -69% Total -73%
We support country-wise LCS modeling through SD for Asia-Pacific and the world- We have continued AIM Training Workshops since 1995 - 16-20 Oct 2006 at NIES South Africa Taiwan, China India China Thailand Korea Malaysia Indonesia Brazil Japan Russia USA
We qualify and quantify possible future LCS visions using AIM models Akemi Imagawa
cross Designed by Hajime Sakai (airbox-pin@nyc.odn.ne.jp)