Download
1 / 36
360 likes | 477 Views
JINR participation at Linear Collider Physics and Detector R&D. A.Olchevski. 5 th Workshop on the Scientific Cooperation Between German Research Centers and JINR 17-19 January 2005. Dubna. Subjects to cover. Beam Energy Measurement Forward Calorimeter Forward Tracking Hadron Calorimeter

E N D
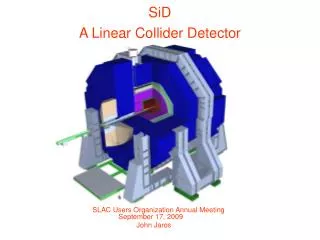
JINR participation at Linear Collider Physics and Detector R&D A.Olchevski 5th Workshop on the Scientific Cooperation Between German Research Centers and JINR 17-19 January 2005 Dubna
Subjects to cover • Beam Energy Measurement • Forward Calorimeter • Forward Tracking • Hadron Calorimeter • Physics
The Energy Spectrometerat the ILC DESY – Dubna - TU Berlin Collaboration
Physics requirements • Mass of top quark: (theor. uncertainty ~ 40 MeV) →ΔEb/Eb≈10-4. • Mass of Higgs boson: (theor. uncertainty ~ 40 MeV) →ΔEb/Eb≈10-4 • Mass of W-boson: (ΔMW~ 5 MeV) →ΔEb/Eb≈ 5∙10-5
Main idea of the spectrometer Concept: determination of the bending angle θ of charged particles through a magnet 3 magnets (one analyzing, two ancillary) and a series of BPMs (Beam Position Monitor) Measurements at different nominal LC energies are proposed to be performed at constant θby adjusting the current to the magnets. Θ= bending angle → B= magnetic field
Responsibility of Dubna team • Simulation of the magnets • Magnetic measurements on the prototype and the design of the instrumentation for it • Slow control of spectrometer • Alignment and stabilization • Production of magnets (in case of acceptance of the project)
Dubna magnetometers S.Ivashkevitch
Analysisof stability and alignment is in progress Solutions and proposals • construct the spectrometer on a single girder (grounded to the floor, ~25 m long, control its stability) • BPM-positioning needed ~ 10 µm (laser interferometer resp. piezoelectrical devices or flexible bearings) • B-field stability and control → power and temperature control → permanent field measurements with two . complementary methods Stability will be a key issue
Complementary methods for beam energy determination • SR produced in magnets of the spectrometer (Dubna- Lomonosov MSU) – simulation, technical evaluation • resonance absorption of laser light (YerPhI, Armenia - Dubna ) – theoretical estimation, simulation • radiative return using e.g. e+e- -> µ+µ-(Dubna) –theoretical estimations • polarization rotation measurements • Moller scattering CROSS-CHECKS needed Details are available on the Workshops Home Page http://www-zeuthen.desy.de/main/html/aktuelles/workshops.html
Forward Calorimetryactivities 1. CVD Diamond sensors. GPI-JINR-DESY 2. Simulation. JINR-DESY 3. Physics. JINR-DESY
The complete system combines the microwave plasma reactor, vacuum and gas distribution system and instrumentation rack. The system is computer controlled. Microwave power source - 6 kW at 2.45 GHz, variable output Reaction gases: CH4, H2 (O2, Ar or CO2 optional) Gas is distributed with four mass flow controllers Gas process pressure: 20-120 Torr Substrate diameter: 76 mm (thick films), up to 100 mm (thin films) Substrate temperature control with a pyrometer Growth rate: 0.8 – 2.5 microns/hour (optical quality material) Diagnostic ports: 4 quartz windows Chamber: stainless steel, water cooled
Fig. 1. Responsivity (a.u.) vs photon energy for a diamond film of 0.28 thickness measured on the growth side (red squares) and nucleation side (blue circles) of the sample. Bias voltage is 50 V. Open circles – the response on growth side at 10 V bias voltage. 25 microns were polished away from the nucleation side to remove the most defective material.
Fig.2. Alpha spectrum (241Am) for CVD-det. #5 at bias +500 V on rear contact. Test pulse is 14.4 fC (86400 e), 1ch. ADC=40 e.
Simulation program Shower from 50 GeV electron Energy deposition in diamond
Bhabha scattering simulation (in BeamCal angle range) Cross section vs energy cut Events per bunch vs energy cut Non radiative Bhabha (only e+ or e- in the final state) All events with e+ and e- in the final state Total Bhabha cross section
electron angular distribution TEEGG BHLUMI for completely coincident events we have: Xsec_teegg = 31.655 ± 0.483 nb Xsec_bhlumi = 30.426 ± 0.321 nb TEEGG after cut for minimum scattered angle (0.5 mrad)
FORWARDCHAMBERSOF THELCDETECTOR • General layout of one quarter of thecentral tracking
Soft selection rules (2/2/2 from 12)have been applied for further studies of the FCH performance: minimum 2 hits are required for each of 3 projections of a track In ideal case:no dead zonesand wire noise,wire efficiency = 100% tracking efficiency 87%for tracks originating from the e+e- - interaction point 82% for all tracks Mean efficiency, ghost & clone ratesvrsdrift-tube space resolution: Wire efficiency = 100%Wire-noise probability = 0% --only for tracks originating from the e+e- - interaction point -- for all tracks TRACK PERFORMANCE IN THEFCH(soft selection rules 2/2/2) Small dependence on the drift-tube space resolution
Mean efficiency, ghost & clone ratesfor various wire efficiencies and wire noise level( for all tracks in the FCH) Mean efficiency, ghost & clone ratesfor various wire efficiencies and wire noise level( for tracks originating from the e+e- - interaction point) TRACK PERFORMANCE IN THEFCH(soft selection rules 2/2/2) Drift-tube space resolution = 50 µm
The First tests of pilot fast digitization unit for the Tile HCAL
12 kOhm 100 Ohm 22 n 100 Ohm -E 10 kOhm SiPM 470 Ohm 50v
Results for pilot TileCal electronics: • The 32ch unit was designed, built and successfully tested • Single photoelectron peaks can be measured • The possibility of calibration in the self-trigger mode is shown • Dynamic range is estimated to be not less than 50 MIPs • Time resolution at least 2 ns is obtained • Cross-talk between neighbour channels is measured at the level of about 0,25% • More studies are needed (RC, stability, time resolution) • Many solutions for the DAQ system is reserved in the design of the module and should be discussed
Authors/Participants: A.Skachkova, N.Skachkov ( Dubna ) K.Moenig ( DESY, Zeuthen ) A.Bartl, ( University, Wien ) W.Majerotto ( HEPHY, Wien ) April 2004- talk given at LCWS2004 , Paris (to appear in Proccedings of this Conference) In STANDARD MODEL: TOP-quark is the heaviest one In SUSY: STOP-squark thelightest one i.e. STOPs have better chances to be discovered! Studied process (at Etot = 1GeV) : gamma-gamma STOP + antiSTOP SUSY study at ILC:Main task: STOP-squarks pair productionin polarizedPHOTON-PHOTONcollisions
MSSM model was used with: M_gluino = M_squark = 370 GeV, it corresponds to M_stop1 = 167 GeV. Main background: Final states were defined by 2 decay channels: SIGNAL: BACKGROUND:
STOP/Top production processes have the same observable particlesin final states!(differ only by neutralino pair presence in STOP case)The authors find out a set of physical observables which distibutions look very different for signal and background. For example: • 1. Total energy, deposited in Calorimeter (fig.1, red is STOP, green is top): E_cal_tot. • 2. Invariant mass of two b_jets (fig.2): M_Bjet_Bbarjet
Analogous effect was shown for two other invariant masses.Important: All figures 1-4 look much more better than in LHC case,i.e. LC may be better suited for stop pair study than gluon-gluon channel at LHC 3. Distributions for invariant mass of b-jet and of two quark jets from W decay in STOP/top cases (fig.3, red is STOP, green is top): M_Bjet1_Jet2. 4. Invariant mass of two b-jets + two jets from one W decay and of muon from another W decay (fig.4): M_4jet_mu.
Conclusionthe work on Instrumentation, Software, Simulation and Physics should be continued