Download
1 / 59
600 likes | 619 Views
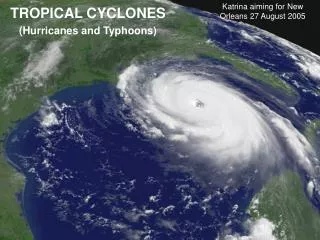
Tropical Cyclones and Climate: Some New Findings. Kerry Emanuel Program in Atmospheres, Oceans, and Climate MIT. Some Issues. What processes control rates of genesis of tropical cyclones? What processes control the actual and potential intensity of TCs?

E N D
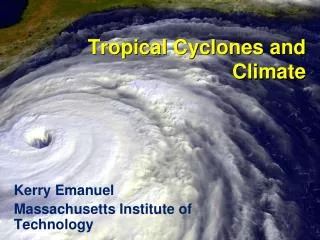
Tropical Cyclones and Climate:Some New Findings Kerry Emanuel Program in Atmospheres, Oceans, and Climate MIT
Some Issues • What processes control rates of genesis of tropical cyclones? • What processes control the actual and potential intensity of TCs? • Do TCs have important feedbacks on climate?
Atlantic Sea Surface Temperatures and Storm Max Power Dissipation (Smoothed with a 1-3-4-3-1 filter) Years included: 1870-2006 Power Dissipation Index (PDI) Scaled Temperature Data Sources: NOAA/TPC, UKMO/HADSST1
Theoretical Upper Bound on Hurricane Maximum Wind Speed: Surface temperature Air-sea enthalpy disequilibrium Ratio of exchange coefficients of enthalpy and momentum Outflow temperature s0* = saturation entropy of sea surface sb = actual entropy of subcloud layer
Condition of convective neutrality: sb = s* of free troposphere Also, s* of free troposphere is approximately spatially uniform (WTG approximation) approximately constant What matters, apparently, is the SST (s0*) relative to the tropospheric temperature (s*)
Can SST Vary Independently of s*? Ocean Surface Energy Balance:
Answer: On time scales long enough for the ocean mixed layer to be in thermal equilibrium (>~ 1 year) • Potential intensity is determined by local radiative balance, local convergence of ocean heat flux, local surface wind speed, and local outflow temperature only • Remote influences limited to remote effects on surface wind surface radiation ocean heat flux and, in marginal zones, on outflow temperature • SST cannot vary independently of free atmospheric temperature
Interpretation of Recent Trends in Potential Intensity Based on NCAR/NCEP Reanalysis
Very High Resolution Modeling of the Response of Tropical Cyclones to Climate Change
The Problem: • Global models are far too coarse to simulate high intensity tropical cyclones • Embedding regional models within global models introduces problems stemming from incompatibility of models, and even regional models are usually too coarse
Histograms of Tropical Cyclone Intensity as Simulated by a Global Model with 50 km grid point spacing. (Courtesy Isaac Held, GFDL) Category 3
Probability Density of TC Damage, U.S. East Coast Damage Multiplied by Probability Density of TC Damage, U.S. East Coast
To the extent that they simulate tropical cyclones at all, global models simulate storms that are largely irrelevant to society and to the climate system itself, given that ocean stirring effects are heavily weighted towards the most intense storms
What are the true resolution requirements for simulating tropical cyclones?
Numerical convergence in an axisymmetric, nonhydrostatic model (Rotunno and Emanuel, 1987)
Another Major Problem with Using Global and/or Regional Models to Simulate Tropical Cyclones: Model TCs are not coupled to the ocean
Our Solution: Drive a simple but very high resolution, coupled ocean-atmosphere TC model using boundary conditions supplied by the global model or reanalysis data set
CHIPS: A Time-dependent, axisymmetric model phrased in R space • Hydrostatic and gradient balance above PBL • Moist adiabatic lapse rates on M surfaces above PBL • Boundary layer quasi-equilibrium • Deformation-based radial diffusion
Ocean Component: ((Schade, L.R., 1997: A physical interpreatation of SST-feedback. Preprints of the 22nd Conf. on Hurr. Trop. Meteor., Amer. Meteor. Soc., Boston, pgs. 439-440.) • Mixing by bulk-Richardson number closure • Mixed-layer current driven by hurricane model surface wind
Ocean columns integrated only Along predicted storm track. Predicted storm center SST anomaly used for input to ALL atmospheric points.
Comparison with same atmospheric model coupled to 3-D ocean model; idealized runs:Full model (black), string model (red)
Application to Assessing Tropical Cyclone Risk in a Changing Climate
Approach: Step 1: Seed each ocean basin with a very large number of weak, randomly located cyclones Step 2: Cyclones are assumed to move with the large scale atmospheric flow in which they are embedded, plus a correction for beta drift Step 3: Run the CHIPS model for each cyclone, and note how many achieve at least tropical storm strength Step 4: Using the small fraction of surviving events, determine storm statistics. Details: Emanuel et al., BAMS, 2008
200 Synthetic U.S. Landfalling tracks (color coded by Saffir-Simpson Scale)
6-hour zonal displacements in region bounded by 10o and 30o N latitude, and 80o and 30o W longitude, using only post-1970 hurricane data
Calibration Absolute genesis frequency calibrated to North Atlantic during the period 1980-2005
Genesis rates Western North Pacific Southern Hemisphere Eastern North Pacific North Indian Ocean Atlantic Calibrated to Atlantic
Cumulative Distribution of Storm Lifetime Peak Wind Speed, with Sample of 2946Synthetic Tracks
3000 Tracks within 100 km of Miami 95% confidence bounds
Captures effects of regional climate phenomena (e.g. ENSO, AMM)
Year by Year Comparison with Best Track and with Knutson et al., 2007
Couple Hurricane Model to Storm Surge Model (ADCIRC) Results for the Battery, New York City
Importance of Potential Intensity in Controlling Tropical Cyclone Activity
Now Use Daily Output from IPCC Models to Derive Wind Statistics, Thermodynamic State Needed by Synthetic Track Technique
Compare two simulations each from 7 IPCC models: 1.Last 20 years of 20th century simulations2. Years 2180-2200 of IPCC Scenario A1b (CO2 stabilized at 720 ppm)
Application to the Climate of the Pliocenewith Alexey Federovand Chris Brierley, Yale