Download
1 / 41
410 likes | 437 Views
This research explores the effective permeability and design parameters for Swiss Rolls at 21.3 MHz, using an Espanex material with low loss and high anisotropy. The study includes quantitative measurements of field distributions and numerical simulations using Microw ave Studio (MWS).

E N D
DALHM ProgressMarch – July 2004 Mike Wiltshire
Swiss Rolls: Effective permeability • Design for 21.3 MHz (0.5 T MRI) • Espanex material, low loss, Q ≈ 65 • Highly anisotropic: |mzz(max)| ≈ 35 • Very “active”: (wp – w0)/w0≈ 40% Fitted values are w0 = 21.55, G = 0.35, F = 0.56 (space filling)
Swiss Roll metamaterial sample • Construct 300 off, 50 mm long, Swiss Rolls • Tune them all to 21.5 ± 0.1 MHz, using capacitively coupled sleeves overhanging by 10 mm • Square packing (with spacers) to make a slab of material, 192 mm square, and 60 mm thick Thanks to John Cobb for making the rolls and to Stephen Wiltshire for help with the tuning
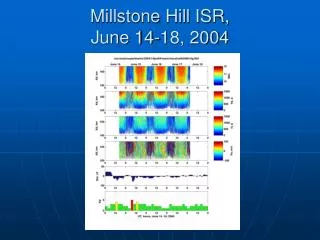
3mm loop detectors, scanned in XY plane Z Slab of Swiss Rolls Hx Hy Hz X 3mm loop source Y Scanning Experiment • Quantitative measurement of transmitted field distributions using XY table • Place a 3 mm diameter loop source under the prism centre • Scan 3 mm loop receivers in the xy plane • Sweep frequency 15 – 35 MHz • Record amplitude and phase • Process as movies of field distribution vs frequency and hence m • Report here the behaviour of Hz
Propagation in an effective medium • Consider an electromagnetic wave propagating through a highly anisotropic, effective medium • Maxwell’s curl equations are • With e = 1 and eliminating E, we get • In terms of B in the x,z plane • The dispersion relation is • k0 ~ 2p/14 m whereas kx ~ 2p/14 mm, so kx >> k0and
At negative m … • We see resonant modes of the square prism. • Each of these modes has a different k// • Resonance in the prism defines kz • The dispersion relation was • Recall that k0 ~ 2p/14 m whereas k// ~ 2p/14 mm, so k// >> k0and • We can use this to find the values of m appropriate for each mode • Compare this to the m from the original permeability measurement • Remember that the permeability data takes no account of the packing, so we must determine the correct filling factor
The effective medium approach • The Swiss Roll slab acts as a short uniaxial waveguide. • Propagation within the guide is governed by the dispersion relation of the effective medium. • Normal modes of the guide are determined by its shape and the boundary conditions. • For each normal mode, transmission and reflection coefficients are derived for the air - material interfaces, and hence their overall transmission. • Excitation by a small dipole source which couples to a selection of the normal modes. • Calculate transmitted field distribution above output surface.
Transmission & Reflection Coefficients • Dirichlet (Hz = 0) or von Neumann boundary conditions (dHz/dn = 0) at edges? • Bz and H// continuous at z = 0 and z = d
Initial comparisons • von Neumann Boundary conditions appear slightly better and are nearer the physical reality
Transmitted field on resonance Input field (magnetic dipole) Output field 21.5 MHz
Comparison with experiment • Result for infinite slab matches at resonance (no lateral boundary conditions) • At 28.75 MHz, m = 0 and we predict a minimum (huge impedance mismatch), but we observe significant intensity. Do imperfections / granularity allow transmission? • At intermediate frequencies, we see complex patterns, with reduced overall intensity, all with a central peak due to flux trapping within a roll. • Make detailed comparisons of patterns with this removed. Concentrate on the minima in the patterns.
Comparison of Fourier coefficients The normal modes assumed in the calculation are not correct
Numerical Studies with Microwave Studio (MWS) • Use the effective medium description in a numerical calculation of the field distribution through a slab. • MWS allows anisotropic magnetic material with Lorentzian dispersion, which matches our material. • Preliminary calculations showed that the boundary conditions (Htang and Bperp continuous) were not correctly obeyed: no pinning round the edge • Review models for a known situation: a sphere in a uniform field
Lorentz model, m = -2 Lorentz model, m = +2 Drude model, m = -2 MWS results NB: Since this is a linear system, the dispersion model should not affect the result: the field distribution should just depend on the permeability
Conclusions • We have measured the transmitted field distribution of a slab of “Swiss Rolls” as a function of frequency in the very near field, and interpreted it in terms of the resonances of a square prism • The continuum model in a waveguide geometry describes some of the key features of the data, but the boundary conditions in the analytical theory are not correct • MWS does not treat the Lorentz (resonant) model correctly in the negative permeability regime, but the Drude model is OK, so we have to calculate the response on a point-by-point basis across the frequency range using the Drude model
The “Great Wall”: RF imaging? • The “poor man’s perfect lens” operates in the very near field and requires only m = -1 (but isotropic) • In 2-D, we only need mx = mz = -1, so use a log-pile construction and extended sources
The “Great Wall”: RF imaging? • I have measured:- • Single source (parallel wires, central null) as a function of distance from wall • Two sources (parallel wires, central null) as a function of their separation • Two sources (antiparallel wires, central max) as a function of their separation • Single source ((parallel wires, central null) tilted to look for Goos-Handschen shift
Goos Handschen shift through Great Wall Predicted “source” positions: 92 + 20 = 112 mm and 108 – 22.5 = 85 mm in the plane at 40mm
The “Great Wall”: RF imaging? • I have measured:- • Single source (parallel wires, central null) as a function of distance from wall • Two sources (parallel wires, central null) as a function of their separation • Two sources (antiparallel wires, central max) as a function of their separation • Single source ((parallel wires, central null) tilted to look for Goos-Handschen shift • In all cases there is evidence of “imaging”, but none is conclusive. • Issues are:- • Accuracy of mx = mz relationship • For which frequency is m = -1? • Finite size of wall gives spatial resonance effects (like the prisms) • Achievable resolution (predicted to be ~80mm) • Solutions / actions:- • Build improved sample • Deduce from m = 0 frequency • Build wider (but lower) wall • Use wider spacing of sources
Application: A Metamaterial RF Yoke? • We could build a yoke from metamaterials for use in MRI • What would it do? • Remote source • Remote detection • Enhanced coupling Present Objectives:- • Check component viability • Assemble a prototype and test it
Testing the performance of the elements • Single roll behaviour:- • Signal is constant along an individual roll • Depends on length: lower for longer rolls (longer return path) • Joining single rolls:- • Excess loss for straight junction depends on roll length • 90° bend incurs further loss (~2x straight loss) • Full yoke of single rolls is too lossy • Joining bundles of rolls:- • Less sensitive to alignment • Mitred corners minimise bend loss • Full yoke becomes viable
Further tests on bundles: co-planar loops • 11 mm diameter untuned loop as source, 33 mm diameter untuned loop detector, placed between pole pieces. • Poles alone give peak of ~7dB: impact of high permeability • Signal decreases with increasing length of bundles to ~5.2dB • Closing the yoke increases signal to ~6.1dB
Proof of Principle Device • Assemble bundles of 7 rolls • 45° mitred corners • 11 mm diameter untuned loop source in gap • 33 mm diameter untuned loop detectors in gap and on yoke • Scan frequency from 15 to 35 MHz with network analyser • Record signal, referenced to co-planar, concentric loops outside yoke • Maximum signal at permeability maximum
Improved materials & construction • Lower loss material with higher Q (~65) being tested • Methods to reduce junction loss being investigated
Conclusions • We have built a yoke using metamaterials • It functions correctly:- • Enhanced signal detection observed • Flux transfer verified • But improvements are needed:- • Lower loss material • Lower loss construction • Metamaterial tuning • Combine with other metamaterial components • Potential to enhance nmr sensitivity.
Next Steps…… • Calculate mean field model for square / hexagon / wall • Complete measurements and analysis of “Great Wall” • Develop yoke & concentrators