Download
1 / 41
410 likes | 516 Views
This report summarizes the current progress in visualization tools and project implementation for high-energy physics experiments at CERN. Key updates include the status of the event display, integration with ROOT, and advancements in data reconstruction. Various projects focus on debugging, data analysis, and user requirements for an enhanced framework, with features like interactive track reconstruction and secondary vertex analysis. The AliEVE environment is also introduced, highlighting its capabilities in visualizing detector geometry, event data, and simulation records.

E N D
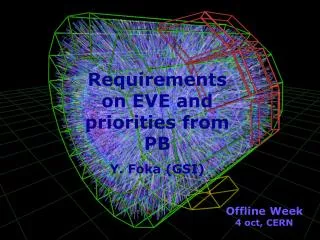
Progress on VisualisationTools and ProjectsY. Foka (GSI) • Status of event display • Overview of projects and progress in implementation • Visual scanning procedure and progress in implementation pp, CERN 21.04.06
Event Display Status for more details on the Event Display see Matevz home page mtadel.home.cern.ch/mtadel NEWs • merge with ROOT DONE • Repackage for distribution in AliRoot DONE AliRoot to be released within the next few days
Some projects Trigger and Detector understanding and performance Debugging and development of reconstruction (detailed comparison with MC truth) Visual inspection of reconstructed real data Visual analysis (measure multiplicity)
Users requirements are being collected iterating with the PWGs (see Y.F. presentation to PWG3) - Overview of requirements for coherent development of the framework - Commonalities of detectors and PWGs requirements - Prioritization of tasks
Some requirements • Read real and simulated data (formats) • Inspection and comparisons(via track label) • Interactive reconstruction of tracks and vertices • visualise/highlight all points/tracks that belong to the same track/vertex • select few points (raw data or rec clusters) and fit a helix • (if raw data, deal with alignment, calibration; ignore at first place) • add or subtract points/tracks and refit a track/vertex • vertexing • specific to secondary vertex analysis • calculate invariant mass for assigned mass hypothesis • calculate pt of secondaries on the line of flight of parent • calculate global impact parameter of secondary relative main vertex Appropriate projections Appropriate transformations to include ITS + TPCetc
Progress on some projects • Check reconstruction • Panos has provided classes in AliRoot to filter out a list of • tracks (events) according to certain track (event) selection criteria • Matevz included this functionality into the Event Display macros • Panos provided a list of events and Matevz read them in • Read MC hits together with the ESD fitted track • and via track label overlay hits on a given track • Note: • - hits come from full propagation in Geant3 taking into account all physics process • - the lines are drawn by the event display ideal helix parametrisation • based on the fitted track parameters and assuming constant magnetic field • TPC test • Alja is working on reading TPC digits at the moment • with the aim to have a 3D representation (of raw data) in the new framework • - Svetan is progressing with reading raw data still some problems with ALTRO • Interactive reconstruction • Marian is modifying helix parametrisation class (Riemann sphere) to be used • in the event display (input x,y,z of selected points)
For TPC events 3D visualisation of raw data for TPC test TPC 3D pixel: divide TPC in volume elements (voxels) (dimensions of pads and width of time step) and paint each voxel with colour coded ADC value
Visual scanning procedure • Read in raw data • (assume calibration and alignment are sufficiently good) • (optimize trigger thresholds to get max good events, minimize bgr) • In progress (Alja, Svetan) • Select by eye (appropriate projections or 3D), • and click on points of a track (ADC colour coded max) • get xyz, give it input to helix parameterization class • Into thinking (Matevz); will take time • Ideal helix parameterization; get xyz as input • output the fitted track parameters • and main vertex via extrapolation to beam axis • Into doing (Marian) maybe later today • needs basically transformations of coordinate system • and appropriate representation of fitted parameters • Get fitted info into the Event Display and visualize; • draw helix extrapolation based on fitted parameters • mark the main vertex
Visual scanning procedure • Define (hardwire) the Interaction Point • Count primary tracks (vertex in IP), • Get eta, pt • Fill out “electronic scanning sheet” and histograms • Rotate randomly the events and get fiducial volume • (eta/pt acceptance and efficiency) • ? Procedure for scanners efficiency • (based on double scanning a number of events)
ATLAS example normal and compressed scale in the r - f plane
AliEVE ALICE Event Visualization Environment March 2006: status Matevž Tadel
Overview • Introduction: EVE .vs. event-display • General design ideas • Status: screenshots • Conclusion
EVE: definition / general requirements Event Visualization Environment provides “visualization of” and “Graphical User Interface to”: • detector geometry • event data • simulation records: kinematics, hits, digits • raw data • reconstructed objects: clusters, tracks, kinks, V0's, primary vertex • physics objects: b-tags, Z0, H-candidates, ... • reconstruction & analysis algorithms • grid interface for visualization of remote-data • calibration and alignment data • simulation algorithms • detector and machine status
EVE: purpose Experts: • Visual debugging – of mostly everything • Facilitate development of reconstruction and analysis algorithms Non-experts: • Help users understand the detector, event structure and reconstruction algorithms • Presentations, demonstrations & outreach activities All can’t fit in the same box! EVE serves as a framework for construction of Event Display programs.
ALICE central Pb-Pb event properties 50-times the event-size of other LHC experiments. • Large data size: • 80 MB compressed raw-event • 1.5 GB size of full simulation/reconstruction Problem for reading (speed) and keeping it in memory. • Large number of tracks, clusters, ... • Kinematics: 60k primaries, 600k stored • Hits: 150M (TPC); Clusters: 3.2M (TPC), 1.6M (TRD) • Reconstructed tracks: 16k That’s how this looks ...
150M TPC hits thinned down to ~6M (1/cm)
Design guidelines I. 1. ROOT trees provide an efficient & general selection mechanism • ALICE data packed as trees already • selection – any formula; post-processing of entries • advanced tree features (friends, indices) allow usage of user-provided data 2. Use ROOT philosophy modular, loosely coupled class toolbox • rely on GUI and OpenGL elements from ROOT • provide additional elements and improvements • provide thin application layer to simplify usage
Design guidelines II. 3. Use CINT scripts for: • steering of data extraction • preparation of visualization objects • creation of GUI elements 4. Provide application core: • execution environment for scripts • event management & navigation • set of visualization atoms • management of visualization / GUI elements
Example script: silicon detector hits void its_hits(const char *varexp = "fX:fY:fZ", const char *selection = "", Option_t *option = "goff") { AliRunLoader* rl = AliReve::Event::AssertRunLoader(); rl->LoadHits("ITS"); TTree* ht = rl->GetTreeH("ITS", false); ht->Draw(varexp, selection, option); ReveGui::GuiPointContainer* points = new ReveGui::GuiPointContainer("ITS Hits", ht); points->SetMarkerColor((Color_t)2); points->SetMarkerStyle((Style_t)6); gReveGui->AddRenderElement(points, Form("sel=\"%s\", N=%d", selection, points->GetN())); gReveGui->DrawRenderElement(points); }
Design – benefits • Application core not experiment specific can be included in ROOT distribution • Via scripts, users gain full flexibility • edit them for specific selections, packing of output • extend them to include user’s private data • combine them together Allows fast development of specific display programs • Data can be visualized directly from ROOT • trees and scripts can be packed together in a single ROOT file containing several events • independent of experiment software laptops, unsupported platforms use by universities, outreach
ROOT standard GL viewer REVE browser/editor: editing geometry note check-boxes and color-tags
Silicon Drift Detector digits central event • Digits require: • 2D displays • several levels of detail • different view modes • (including histograms)
Visualization elements • geometry (part of ROOT) • point-sets (hits, clusters), lines (tracks) need different track extrapolation methods • parametrized object containers assign values to entries and then do fast selection with scrollbars • quad-sets (ITS digits) and box-sets • textured surfaces (planned for TPC sectors) • 3D arrows and text (planned in ROOT) • tell us ...
Conclusion • We have a prototype: • merge with ROOT (in progress) • consolidate API • repackage for distribution in AliROOT • prepare examples In principle not more than 2 months. Would like to offer a consistent environment for developers and users. • After that – opportunistic development