Download
1 / 62
790 likes | 1.57k Views
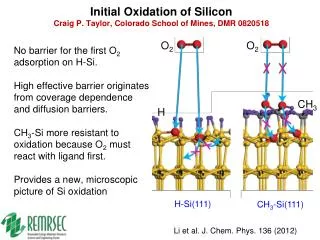
OXIDATION OF SILICON. a) Deal-Grove * analysis b) Cabrera - Mott analysis c) Stresses in oxide d) Oxidation Si self-interstitials. * Andy Grove, early work before he became CEO of Intel. Depending on pressure and temperature, SiO 2 is either stable or not.

E N D
OXIDATION OF SILICON a) Deal-Grove* analysis b) Cabrera - Mott analysis c) Stresses in oxide d) Oxidation Si self-interstitials * Andy Grove, early work before he became CEO of Intel
Depending on pressure and temperature, SiO2 is either stable or not. Can be calculated from thermodynamics. Si + SiO(2) 2 SiO The result is shown as curve 1. The deviation from the thermodynamic prediction (true for equilibrium) is due to kinetic effects which can be incorporated into prediction of a critical growth model. This is curve 2. Heating in UHV vacuum is used by surface scientists ‘to blow of the oxide’.
A. Deal Grove Model 3 limiting cases exist: Gas phase limited, diffusion across oxide limited, incorporation limited. Oxygen Profile If most of the oxygen (O(2)) profile drops across the stagnant layer, process limited by diffusion in the gas phase. The transport coefficient is denoted as h. C= 0 Silicon Oxide
Below is a close up showing the discontinuity in O(2) profile at the outer oxide interface. It reflects the fact that there is more oxygen per cm3 in the gas phase, then can be dissolved in silicon dioxide. If the oxygen pressure is increased in the gas phase, more oxygen is dissolved in the silicon (more later). Cg Silicon Oxygen Concentration Profile. Silicon Dioxide
In practice, the flux in the gas phase is rarely rate limiting. • At 1000 C, and 1 atm, there are about 5E18 O(2) molecules per cubic centimeter (That is Cg = 5E18/ccm) • The solubility of oxygen in Si at a 1000 C and 1 atm is only 5.2E16 (Deal Grove analysis, same value is obtained by direct permeation experiments) . I.e., C* = 5.2E16/ccm • If the flux is expressed as • F1 = h (C* - C0) • than the values are as follows (dry, 1atm, 1000 C): • F1 (um/hr) = 1E 8 (um/hr) ( 5.2E16 - C0)/(2.2E22) • where 2.2E22 is the number of SiO(2) molecules per cm3 in the oxide.
The large value of h has the consequence that even a very slight concentration gradient across the stagnant layer will transport enough oxygen to make the oxide grow. Take a C0 value of 5.0E16 (just 0.2 E 16 smaller than the solubility C* ) and you still get a flux that would correspond to a growth rate (at a 1000 C) of F1 = 9.09 um/hr If one looks up experimental values, one finds something like 0.1 um for dry oxidation in reasonable thick films. Thus other processes must be rate limiting.
B) Diffusion across the oxide limits the growth rate. In this case, the oxygen concentration profile is flat in the gas phase. At the oxide/silicon interface the concentration is zero, since incorporation is much faster than transport across the oxide C = 0
The flux across the oxide is given by the diffusion coefficient times the gradient. If we want the flux in units of oxide growth rate per time we need to divide by the numbers of SiO(2) molecules per cm3. (Otherwise, the flux will be in units of atoms per area and time) F2 = D * [ Co - C I ] / t where t is the thickness of the oxide. Co is the concentration of oxygen on the outer side of the oxide (i.e. oxygen molecules dissolved in the oxide). Ci is the concentration of oxygen dissolved in the oxide lattice very close to the oxide/silicon interface). In general, Co is close to C* (the theoretical solubility of oxygen at a given pressure) since there is essentially no concentration drop across the stagnant layer) , see previous slide
At 1000 C, the diffusivity, D, of oxygen molecules in SiO(2) is about 8E-9 cm2/sec. Activation energy 1.24 eV A typical oxide thickness would be 1000 A = 1E-5 cm Ci is zero, since in such an oxide incorporation is much faster than diffusion of O2 across the oxide. C0 is very close to C* , since diffusion across the gas phase is not limiting so we take the value for C*. With these choices, we get for the flux (in units of cm/s) F2 = (8E-9/1E-5) * ( 5E16 / 2.2E22) = 1.8E-9 which translates into 0.07 um/hr (close to what one sees). Note, however, that F goes as (1/thickness of oxide). Thus for a very thin, say 10 A oxide the flux would be 100 times larger. In this case, incorporation becomes rate limiting.
C) Incorporation is rate limiting In this case, the concentration of O(2) molecules is flat up to the oxide/silicon interface. The discontinuity at the outer oxide surface reflects, again, the fact that in the gas there are 5E18 O2 molecules per cc, and in the oxide there are 5.2E16 (at 1 atm and 1000 C), the solubility for that pressure and temperature. C* C= 0
The process of incorporating the O(2) molecule into Si, forming SiO(2) is described by F3 = ks * Ci where Ci is the concentration of O(2) at the Si/SiO(2) interface. This process is rate limiting in very thin oxides. In this case, the concentration of O(2) is essentially flat through the gas phase as well as the oxide and, at the inner oxide interface equal to the oxygen solubility in Si at 760 Torr, ie. 5.2E16 At 1000 C, and dry oxidation, ks is about 3.6E-4 um/hr. Thus we get F3 = 3.6E4 * (5.2E16 /2.2E22) = 0.8 um/hr
Note that ks is about 4 orders of magnitude smaller than the other linear transfer coefficient, h which controls F1, the flux through the gas phase. This difference in the magnitude of k and h is the reason that transfer through the gas phase is rarely limiting. More specifically, if you derive the kinetics by setting all fluxes equal, you find that the initial linear growth rate is described by: F (linear) = (1/h + 1/ks) -1 (C* / 2.2 E22) [um/hr] Since h is so much larger (4 orders of magnitude at 1000C) than ks , 1/h is a very much smaller number than 1/ks and the equation reduces for practical purpose to the one given on the previous slide
Deal Grove model predicts d2 + Ad = Bt B/A is called the linear rate constant B is called the parabolic rate constant A = 2D[(1/ks) + (1/h)] B = 2DC*/Nl D = Diffusivity ks= SiO2/Si surface reaction rate constant h = gas transportation mass transfer coefficient Nl= 2.2 E 22/ccm (conversion factor) C* = Solubility in oxide
The Deal-Grove law is famous not just for fitting the oxidation data but because the numbers one extracts for the MAXIMUM SOLUBILITY OF OXYGEN IN SI (C*) and the DIFFUSIVITY OF O(2) IN SOLID SiO(2) agree with independent measurements of these quantities. In addition, the model explains the temperature and pressure dependence of A and B.
And here are the numbers C* values in SiO(2) at 1000 C (solubility) O2 5.2 E 16/ccm H2O 3.0 E 19/ccm Activation Energy for Diffusion at 1000 C O2 1.24 eV H2O 0.71 eV Prefactor, Do, at 1000 C O25.3 E-4 cm2/s H2O 1.8 E-7 cm2/s Diffusivity at 1000 C O2 6.9E-9 cm2/s H2O 2.9E-10 cm2/s For comparison, permeation of O2 into SiO2 yields a value 5.5E16/ccm. Infrared absorption yields a value, for H2O of 3.4E19 For comparison: H2O in fused silica: 0.79 eV, OH in silica: 0.69…0.78 eV
How do we know what migrates ? O2 (gas) O2 (solid) [O2 (gas) ] [O2 (solid)] Si = K O2 (gas) O + O [O2] [O] [O] = K If the oxygen would dissociate, its concentration in the oxide would vary with square root of oxygen pressure.
Experimentally, one finds • P 1 dependence for the parabolic oxidation rate (wet or dry) • P1 dependence for the linear oxidation rate, wet • P0.7…0.8 for the linear oxidation rate, dry This has been interpreted that the interface reaction constant kc varies with pressure as P-0.3. I.e., the rate gets slower at higher pressure. Le Chatelier’s principle predicts that a process that increases volume will be opposed (‘slow down’) by higher pressure. Since the P-0.3 dependence is only seen during dry oxidation, the ‘atomic’ stress at the interface might be higher.
The linear rate constant increases with pressure less than linear. Symbols are experimental data. The line labeled 20x1atm is where the linear rate constant should be if it would scale linearly with pressure. Note that the activation energy does not change either with T, or pressure Dry Oxidation
The high pressure data for the parabolic constant scale exactly with pressure. Note that the activation energy seems to change from 1.77 eV to 1.42 eV as the the oxidation temperature is higher than about 900 C Dry Oxidation
Activation energy. • The activation energy, for the parabolic rate constant is that of the D, the diffusion coefficient of the oxidizing species. • For dry oxidation, the value depends on temperature. • 800….900 C, its 1.77 eV • 900 … 1000 C, its 1.42 eV • The change reflects the fact that dry oxide becomes noticeably ‘viscous’ at T > 900 C. Diffusion is very sensitive to microstructure (polymer scientist would say to free volume). • More generally, the activation energy, is depends on stress - this is considered in better models of oxidation under stress (e.g. in the formation of the “birds beak”).
For wet oxidation, the parabolic rate constant also changes. • Below 900 C, its 1.17 eV • Above 900 C, its 0.78 eV • Again, this reflects the fact that the oxide can “flow” above about 900 C. • The value at high temperatures agrees well with the diffusivity of water in fused silica (0.79 eV, Moulson and Roberts) and OH diffusion in silica films (0.69-0.78 Rigo et al) isotope exchange).
Defects at the Si-Sio2 interface: • Play a role in the electrical properties of the Si/SiO2 interface • Include: • Broken bonds - non bridging oxygen • Hydroxyl (OH) groups • Hydrides (Si-H) groups • Fe atoms, other transition metals clustering at the surface. • The equilibrium concentration of structural defects (broken bonds), just as in the case of vacancies, depends on the energy of formation.
B. Cabrera Mott Mechanism Oxide Note that this model assumes a single oxygen atom - not an oxygen molecule eV Electron Level Oxygen Atom in oxide • Electron gets transferred from semiconductor or metal into oxide • It finds a deeper level on an oxygen atom (now negatively charged)
The basic idea of Cabrera and Sir Neville Mott: • A field (space charge) is set up in the oxide. • The space charge region is xo= (kT/8nce2)1/2 where nc is the density of oxygen ions in the lattice, the dielectric constant, k the Boltzmann constant The oxygen (- charged) drifts (rather than diffuses) across the interface to meet the Si. In thin oxides, (Say 2 nm), the fields, even with a small potential difference (say 0.2 V) will be very high (106V/cm).
The Cabrera Mott model, assuming a local electric field requires that the oxidizing species, to be influenced by the field, is not neutral. O2 will not qualify. However, there is an equilibrium between molecular and atomic oxygen O2 O + O and a small number of oxygen atoms will be present. Although O is low in concentration, at low temperatures (where the model is popular) single oxygen may dominate because it can drift so much faster than oxygen molecules can diffuse.
Stress in oxides: • Stress is measured in a variety of ways: • laser reflection • x ray reflection • gas ‘bubbles’ • Modern methods can measure very small curvatures (radii > 300 m). • Thus we know the effective stress very accurately.
Stress at room temperature. This is NOT the stress at the oxidation temperature because Si and SiO2 shrink at different rates as the wafer cools down. The + are from Bogh (1976). They do not agree with other authors, perhaps because Bogh used O2 + H2O
Stress at oxidation temperature. The data were measured directly during oxidation. The other data are calculated values, taken room temperature stresses and adjusting them for the different thermal expansion of Si and SiO2.
Surface Interface Stress is not uniform through thickness The surface, which had the longest time to relax, has the lowest stress.
The change in refractive index of thermal oxide with oxidation temperature are due to stress. Since the oxide is under compressive stress, its density, , increases. The stress of T> 1150C is flat because the oxide is so “fluid” that no stresses can build up until the specimens is cooled down to 1150 C
You will learn more about the infamous bird beak later. It forms, when part of the wafer are shielded by a thin silicon nitride layer during oxidation. Part of the oxidation creeps under the nitride, forming the ‘birds beak’ If the stress generated by the local expansion exceeds the critical shear stress of silicon, dislocations form.
A more realistic bird beak, found in the circuit of Hewlett-Packard PA-RISC 7000 Processor PA-RISC stands for Precision Architecture, Reduced Instruction Set Computing; RISC contrasts with CISC. Hewlett-Packard was the first computer company to replace their entire CISC machine families with RISC machines and migrate their users to this faster architecture. Now RISC is the conventional design for high-speed chips. Chip designers are fond of sneaking in all kinds of pictures into their designs….
The critical shear stress is the shear stress at which dislocations form. The critical shear stress of silicon falls with increasing temperature. The exact value depends on the strain rate and the impurities present in the crystal (in particular the oxygen content). Critical Shear stress of silicon at strain rates between 0.5E-4 (squares) to 0.5E-2 (triangles) /sec
When the oxidation switches from linear to parabolic, stress at the interface falls. The reason is that the oxidation rate decreases with time. All effects that have to do with stress at this interface decrease therefore, including the generation of point defects (see later)
Stress relaxes by • Interstitials • Plastic deformation at steps • Oxide densification • Viscoelastic (Newtonian) flow • The various mechanisms operating can be plotted in a stress vs temperature, Ashby deformation map. It is important to know where you are in this map ! Ashby type deformation map of SiO2. is the density, which increases with
The interstitials have to go somewhere. The plate out as oxygen induced stacking faults (OFS) OSF The OSFs grow by absorbing interstitials and shrink by emitting them (or absorbing vacancies). Thus, we can learn about the Ci from measuring size as f(time)
The OSFs first grow with time because rapid oxidation generates many interstitials As the oxidation rate slows down, less interstitials are generated. Eventually, the vacancies win and the OFS begin to shrink. Time (seconds) Solid Line: Experiment. Dashed lines theory. Fat dotted line: transition from linear to parabolic oxide growth V + I Lattice Site How long does it take to reach equilibrium ?
The supersaturation of interstitials is roughly a factor 10 for Si. It falls with time because as the oxide gets thicker, the rate decreases. The vacancies are suppressed but with a delay. We can get these data from analyzing diffusion of P, B, Sb diffusion (Plummer) or OSFs. Oxidation time in seconds
Silicon, undoped OED Oxide Nitride Doped Layer Silicon, undoped After Oxidation Before Oxidation Oxidation Enhanced Diffusion is caused by point defects Do we have to worry about this effect ?
DA is the diffusion coefficient of dopant A which you measure from the broading of the buried doping layer. D*A is the diffusion coefficient of dopant A at the same temperature in the absence of oxidation. Vacancy diffusers (Sb) move less fi = interstitial component of diffusion The diffusivity is up to a factor 6 times higher !
Growing oxide x = 0 L Lateral OED under a nitride film. The vertical scale is effective dopant diffusion coefficient. Lateral OED can occur over hundreds of microns (Data from Mizou)
Implanted channelstop profile, and profile after growth of field oxide (Ph.D. Thesis of Karl Wimmer)
The role of Cl in oxidation (HCL, TCE, TCA) Chlorine removes Si self interstitials injected into the oxide. Therefore, the Ci inside the silicon also falls Cl in the form of organic compound is added to remove metallic impurities and to reduce the supersaturation of interstitials (OSFs) Oxide Silicon
Oxidation of Silicides A silicide is a metal silicon compound. Silicides are used extensively in ICs. If a silicide covers Si, and the silicide is exposed to oxygen at high temperatures, SiO2 will form on top of it. This is shown schematically at left.
D’Heurle, IBM The oxidation rate can be greatly enhanced over that of bare silicon, up to a factor 3. This is believed to be because free charge carriers are available at the silicide/oxide interface, which catalyze the formation of the oxide.
Volume 43, No 3 1999 Special Issue on Ultrathin Oxides
Material issues in ultrathin gate oxides: • Surface preparation • Boron penetration • Trade off of Boron penetration (reduced by adding N) Vs threshold shifts (increasing with nitrogen) • Tailoring of N in oxide • Trade off of gate depletion (decreasing with increasing B) Vs penetration