Methods/Materials: How did you study your question?
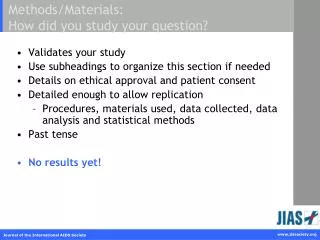
Methods/Materials: How did you study your question?. Validates your study Use subheadings to organize this section if needed Details on ethical approval and patient consent Detailed enough to allow replication Procedures, materials used, data collected, data analysis and statistical methods

Methods/Materials: How did you study your question?
E N D
Presentation Transcript
Methods/Materials: How did you study your question? • Validates your study • Use subheadings to organize this section if needed • Details on ethical approval and patient consent • Detailed enough to allow replication • Procedures, materials used, data collected, data analysis and statistical methods • Past tense • No results yet!
Results: What did you find? • What is the best way to present your data: table, figure or text? • Avoid repetition • Be specific • Present only the results relevant to your question • Relate results to methods, but do not describe them again • Do not discuss yet! !!! Careful with the word ‘significant’ and vagues terms (some - many - few)
Results: Gender analysis • Study participants • Sex/Gender numbers • Single-sex study, …why? • Sex-disaggregated data • Reporting results of subpopulations • Gender analysis • Effect of…, associated with…?
Source: UNAIDS/WHO, 2008 Figures - Exercise Which of these graphs is better to show change over time? A. B.
Figures: Different figures for different messages Source: UNAIDS/WHO, 2008 A line graph is better to show data over time or trends
Source: UNAIDS/WHO, 2006 Figures: Different figures for different messages A bar graph would work better for a different type of data for example ratios • Only when helpful to convey information • Should be understandable without text • Choose type based on the kind of data you have • Avoid overlap with text
Discussion: What do your findings mean? • Do not repeat results, but should be based on the results! • Discuss the importance and implications of your findings • Use key references to place your study within context • Describe any limitations of the study • Conclude with the key points • Did the results answer your question?
What where - Exercise Which section do each of these sentences belong to? • Biomarker testing was completed for 1108 participants out of the total sample of 1127 IDUs. • Five cross-sectional surveys of IDUs were conducted in Georgia in 2009. • Comparison with our study findings demonstrates increases in HIV prevalence in both locations. • The study protocols and questionnaires were approved by the Ethics Review Committee. • HIV prevention in this sub-population, therefore, may lie in strengthening harm-reduction programmes. • Major characteristics of the sample were median age 35 years, male 98.7% and married 49.7%. • Injection drug use remains a major risk factor for HIV transmission. • More research is required to analyze the determinants of HIV risk in Georgian IDUs.
What where - Exercise • Biomarker testing was completed for 1108 participants out of the total sample of 1127 IDUs. Results • Five cross-sectional surveys of IDUs were conducted in Georgia in 2009. Methods • Comparison with our study findings demonstrates increases in HIV prevalence in both locations. Discussion • The study protocols and questionnaires were approved by the Ethics Review Committee. Methods • HIV prevention in this sub-population, therefore, may lie in strengthening harm-reduction programmes. Discussion • Major characteristics of the sample were median age 35 years, male 98.7% and married 49.7%. Table! • Injection drug use remains a major risk factor for HIV transmission. Introduction • More research is required to analyze the determinants of HIV risk in Georgian IDUs. Discussion Adapted from Chikovani et al, JIAS 2011
Which section of a manuscript usually contains the most errors?
References • Credibility • Knowledge and awareness of the field • Validate your claims and arguments • How to write references: • Pay attention to the ‘Instructions for Authors’ of your selected journal