Download
1 / 23
230 likes | 381 Views
Ramp Metering / SWARM Evaluation. ITS Lab – May 27, 2008. Outline. Project Overview Background Ramp Metering SWARM SWARM Evaluation Methodology Results Conclusions. Project Overview.

E N D
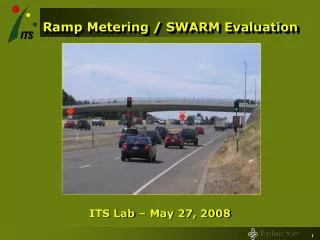
Ramp Metering / SWARM Evaluation ITS Lab – May 27, 2008
Outline • Project Overview • Background • Ramp Metering • SWARM • SWARM Evaluation • Methodology • Results • Conclusions
Project Overview • Using Archived Data to Measure Operational Benefits of a System-wide Adaptive Ramp Metering (SWARM) System • Research Partners • Portland State University ITS Lab • ODOT: Region 1, Research, and ITS • Portland Office of Transportation • FHWA
Project Overview • Study Purpose • Measure benefits of adaptive ramp metering system • Improve understanding of system operation and help “tune” for better performance
Ramp Metering Benefits • Minnesota Before/After Study (2000) • Ramp meters shut off for eight weeks • Congestion and accident rates increased • More delay for on-ramp traffic… • …but benefits system-wide • Increased travel time for short trips (ramp + mainline)… • …decreased travel time for longer trips. (Cambridge Systematics 2001, Kwon et al. 2001, Hourdakis and Michalopoulos 2002, and Levinson and Zhang 2002)
Ramp Metering Background • Types of Ramp Metering • Pre-Timed • Traffic Responsive (Adaptive) Local Global Zhang et al., 2001
SWARM • SWARM first implemented by CalTrans in Southern California • SWARM 1 = Global • SWARM 2a-c = Local • 2c = Portland • Occupancy at local and downstream detectors • Previous SWARM Evaluations • Benefits for mainline travel • Queues at 9 busiest on-ramps increased by over 40% • Combined local/global strategy most effective • Caltrans (2005), Pham et al (2002), MacCarley et al (2002)
SWARM 1 (Global) Algorithm • Uses most restrictive of local and global metering rate
SWARM Implementation • 1981: Pre-timed ramp meters implemented by ODOT • 2005-2006: Adaptive system (SWARM) implemented in phases by ODOT • SWARM is operating on six of seven metered freeway corridors in the Portland region • In general, 6-10 am, 1-7 pm weekdays
Study Corridors • OR-217 SB • June 2006 • AM Peak • I-205 NB • Sept/Oct 2007 • AM & PM Peak • OR-217 NB • Nov/Dec 2007 • PM Peak OR-217 SB OR-217NB I-205 NB
Methodology • Before and after study • 2 weeks pre-timed mode • 2 weeks SWARM mode • Control for various factors • Data sources • PORTAL: ODOT loop detector data, weather, incidents • Measurement of ramp queues • 5-Minute Video Samples (Pilot) • Programmable Logic Controllers (PLCs)
Data Quality Pre-Timed SWARM • I-205 NB • Pre-Timed • SWARM • Implications? • Explanation? Communications infrastructure is critical for an adaptive system
On Ramp Volume • On all corridors studied, SWARM allowed more vehicles onto the freeway than the pre-timed strategy • Why?
I-205 NB 9/21 (SWARM) (3) Metering Activation - at Powell, Johnson Creek, and Sunnyside under SWARM (5) Possible data quality issue (2) Metering Activation/ De-activation (Pre-Timed) (4) Metering activated earlier under SWARM (1) Study Boundaries(Gladstone-Division)
9/21 (SWARM) & 9/28 Pre-Timed Speeds dropped prior to activation Pre-Timed Metering Activation SWARM Note: SWARM Metering Activation Data not collected at Foster Metering activated earlier under SWARM Despite a slightly higher metering rate, SWARM’s earlier activation appeared to delay the onset of congested speeds and allowed for higher and more stable mainline flows.
10/1 (Pre-Timed)& 9/17 (SWARM) (1) SWARM activation matches drop in speed (4) SWARM appears to implement a lower metering rate, responding to lower speeds. (2) But metering at Sunnyside (and likely Foster) activated later under SWARM than Pre-Timed (3) Slightly higher metering rates under SWARM than Pre-Timed
Summary • SWARM allows more vehicles onto the freeway at each on-ramp. • Counter to ODOT’s initial assumptions • Pilot study on OR-217 SB demonstrated a tradeoff between decreased ramp delay and increased mainline delay • Could not conclude that higher on-ramp volumes were the sole cause. • SWARM’s earlier activation times reduce mainline delay under some conditions. • Adjustment of metering rates and other SWARM parameters is needed to improve performance of the system • Communications failures impact quality of SWARM operation • Tradeoff between frequently updating ramp metering plans, and increased need for maintenance and tuning w/adaptive system • Logging capabilities for SWARM/ATMS would make evaluation efforts easier • Ramp queue loop detectors, meter activation times, and actual metering rates set by the SWARM system
Methodology (2) • Our determination of congested conditions was somewhat subjective • Based on fundamental traffic flow relationships • Flow (Volume) • Density (~Occupancy) • Speed The figure shows the expected relationships between the three variables: flow (volume), speed, and occupancy. In the plots from the freeway data, you can see these general relationships in the data. We used the fundamental shapes to define the thresholds for congestion. In the flow-density curve, data to the right of kcap is in the congested regime; we determined occupancy and speed values that generated congested flow.
I-205 NB Performance Measures - AM • Excluding the single highly congested day under Pre-Timed (10/4), delay under SWARM was about 5 percent lower. • We believe the lower level of delay reflects more vehicles on the freeway, given higher on ramp flows. Given lower overall freeway volumes in the AM, there isn’t the adverse effect on mainline performance that there appears to be in the PM.
I-205 NB Performance Measures - PM • Excluding the least congested day, the average delay for “moderately congested” days was nearly 30 percent greater under SWARM operation (comparable to the PM period on OR-217). There were four each of these “moderate” days in the pre-timed and SWARM periods. • SWARM performed better than the pre-timed system on the most highly congested days, which we attribute to earlier metering activation times on those days.
I-205 NB 9/28 (Pre-Timed) Meters de-activate while still congested. (2) Metering Activation/ De-activation (Pre-Timed) (1) Study Boundaries(Gladstone-Division)