Download
1 / 20
200 likes | 331 Views
Watershed Characteristics Approach for Ground Water Recharge Estimation. John L. Nieber, Roman Kanivetsky, Bruce Wilson, Heidi Peterson, Francisco Lahoud, Bioproducts and Biosystems Engineering David Mulla, Soil, Water and Climate

E N D
Watershed Characteristics Approach for Ground Water Recharge Estimation John L. Nieber, Roman Kanivetsky, Bruce Wilson, Heidi Peterson, Francisco Lahoud, Bioproducts and Biosystems Engineering David Mulla, Soil, Water and Climate Boris Shmagin, Water Resources Center, South Dakota State University
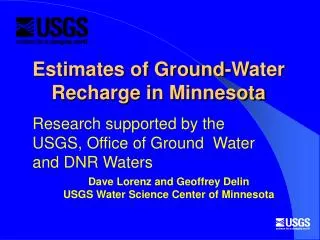
Background • Minnesota ground water is used for a variety of economic enterprises • Ground water discharge also feeds many wetlands, streams and rivers in Minnesota • How does the renewable capacity of ground water recharge vary across the state for both surficial and deep aquifers? • How do current and projected demands for ground water consumption compare with these recharge rates?
Estimating Recharge from Discharge (2007) • “I have no doubt that studying recharge will be high on the list of research topics for the future • I am also confident that the recharge is better understood through the discharge where there is an integrated and observable hydrologic signal, and that discharge is of much more pragmatic concern than recharge”
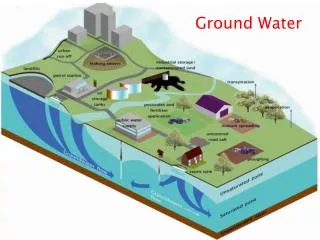
Watershed water balance (after Freeze and Cherry, 1979) Elements of watershed water balance: P- precipitation, E- evapotranspiration, Q- runoff, Qs- the surface water component of average annual runoff, ER- the average annual evapotranspiration from recharge area, ED- the average annual evapotranspiration from discharge area, R- the average annual ground water recharge, D- the average annual ground water discharge
X’ X MN February Low Flow Represents Ground Water Discharge
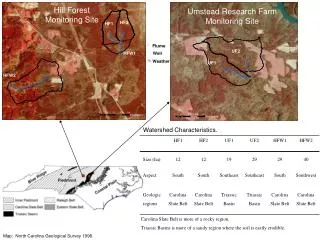
Science Question and Approach • How does landscape and geologic heterogeneity control spatial and temporal variability of stream discharge and ground water recharge across spatial scales? • Stream discharge (recharge) for at least 25-50 years is evaluated at 129 gauging stations in and around Minnesota for February (low flow) conditions as well as annual conditions • Vadose zone, quaternary geology and bedrock geology characteristics and statistical methods are used to regionalize discharge (recharge) data at three scales (1:3,000,000; 1:500,000 and 1:150,000)
Monthly runoff for LMF Laurentian Mixed Forest; EBF Eastern Broadleaf Forest; PP Prairie Parkland (Shmagin and Kanivetsky, 2002) 20 10 in/yr 2.5 0
66.7 54.7 104.768.5 2.3 4.3 4.9 2.4 1.6 Annual stream runoff for Ecological Provinces & Sections Values are of Stream Runoff in [ l/s/sq. km ] 6.03 4.95 9.476.19 6.3 3.9 2.1
Minnesota Bedrock Hydrogeology Precambrian Basement Quaternary sediments and Precambrian Basement Quaternary sediments, Cretaceous confining unit and Precambrian Basement Paleozoic artesian aquifers and Quaternary sediments Paleozoic artesian aquifers
Estimated minimum ground water recharge 1.68 B2 B1 0.50 0.87 B3 A2A1 0.31 3.11 Precambrian basement and quaternary sediments Precambrian basement Minimal monthly stream runoff in Minnesota A= 2.09 B= 0.83 Values are February Stream Runoff in [l/s/sq km] Paleozoic artesian aquifers Paleozoic artesian aquifers and quaternary sediments Precambrian basement, cretaceous deposits and quaternary sediments
Minnesota and East Central Minnesota (ECM) a a- geologic map for state with county boundaries and b- the territory of ECM with the red rectangle is the map with the gauging stations and records of low stream runoff (after Lindskov, 1977), b c- Quaternary and d- bedrock maps (after Kanivetsky, 1978, 1979) c c d
Procedure to acquire an initial matrix, X(n*j) In the matrix: S(m) – watershed with specific landscape characteristic (m= 1, 2, 3… n+) and qm minimal monthly discharge (m= 1, 2, 3… n); “n+”- means that we sometimes have toconsider and code the same watershed with different landscape codes as Sm(2,1) , S m(3,1), and S m(2,2)but with the same discharge- qm a b 1 3 2 2 2 2 c Sm-1 (i,j), qm-1 … Sm(2,1), qm … … Sm(3,1), qm … Sm(2,2), qm … Sm (3,2), qm … Sm+1(i,j), qm+1 … X(n*j) = The matrix is subject to statistical analysis
Example of Average Ground Water Discharge (Finer scale regionalization) Finer scale
Next Steps • Develop three scales of discharge (recharge) regionalization based on vadose zone and landscape characteristics • Hydrologic class • Soil permeability • Slope steepness • Land use • etc
Conclusions • February low flow discharge conditions represent minimum aquifer recharge rates • Estimates of minimum aquifer recharge rates are being developed at three scales of regionalization • Results of this study will be compared with results from other ongoing studies