Download

1 / 62
620 likes | 669 Views
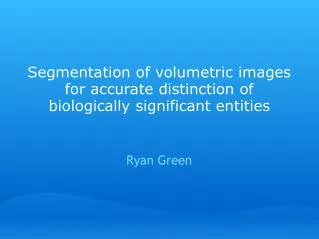
Learn about optimal surface detection in volumetric images using graph search principles. Explore cost functions, smoothness constraints, and minimum s-t cut approaches for 3-D surface detection. Discover a novel, efficient algorithm for surface segmentation in medical imaging.

E N D
Optimal Surface Segmentation in Volumetric ImagesA Graph-Theoretic Approach Kang Li1, Xiaodong Wu1, Danny Z. Chen2, Milan Sonka1 1The University of Iowa, Iowa City, IA 2The University of Notre Dame, Notre Dame, IN
Motivation: Diaphragm segmentation • 3-D: determine diaphragm surface • 4-D: determine diaphragm surface + motion during breathing cycle
Current Approaches to Surface Segmentation • Serial 2-D approaches • All suffer from the lack of context information across slices • Even more apparent in 4-D (3-D+time) • Existing 3-D approaches • Level sets, region-grow, AAMs, etc. have their own weaknesses
Optimal Segmentation Using Graph Searching Principles • Optimality determined by: • Cost function • Smoothness constraints • 2-D: Dynamic programming, Graph Searching… • 3-D: Search space is huge – combinatorial explosion • Design of an efficient optimal surface detection algorithm is highly desirable and challenging.
Surface Detection in 3-D using Optimal Graph Searching • Previous approaches – exponential complexity • Thedens et al. 1995, computationally infeasible, heuristic approach does not guarantee optimality • Frank et al. 1996, 3-D dynamic programming, no optimal solution • Chen, Wu 2002 • s-t cut approach • theoretical proof of optimality • low-order polynomial complexity solution
Our Approach to Optimal (Hyper-) Surface Detection • A novel method in Computational Geometry • Theoretical Framework: Chen, Wu 2002 • Minimum s-t Cut Approach • Low-order polynomial complexity • Applicable to 2-D; Extendible to n-D
Flow-chart of the Method Cost Function Smoothness Constraint Original Image 3-D Graph Construction Graph Cost Transform Find Minimum-Cost Closed Set (Minimum s-t Cut) Surface Solution
Example: Min s-t Cut approach to finding min-cost “path” • Every pixel corresponds to a node in the graph, node costs used • The path intersects with each column at exactly one node • Smoothness constraint: max. vertical distance of neighbor-column nodes = 1 1 Min-cost path (cost = 2) 1
Edge Construction: • Connect each node to its bottom-most neighbor in the adjacent column. • Build vertical edges along each column, pointing downwards.
Cost Transformation: • Along each column, subtract the cost of each node by the cost of the node immediately beneath it. • The bottom-most two nodes are unchanged. 1 -3 5 – 4 = 1 -1 – 2 = -3 1 3 -2 -7
Cost Transformation (cont’d): • M: sum of costs of the bottommost nodes • If M >= 0: • Select ANY one of those nodes • Subtract (M + 1) from its cost 1 -3 1 3 -2 -7 3 – (11 + 1) = -9 -9 M = 3 + 8 = 11 >= 0
Compute the Minimum-Cost Closed Set: • Closed set: a subset of the graph with no edges going out • Minimum-cost closed set: A closed set with the minimum total node-cost. 1 -3 Not a closed set 1 3 -2 -7 A closed set -9
Compute the Min-Cost Closed Set (cont’d): • Can be solved by a Min s-t Cut (Max Flow) algorithm • 2 auxiliary nodes – a start (s) & a terminal (t) are added • An edge-weighted directed graph is built
After applying the min s-t cut algorithm … • Find all the nodes that can be reached from s, and the min-cost closed set is identified. • The upper envelope of the min-cost closed set is the solution.
Simple Examples-t cut approach to finding minimum-cost path- simple 2D graphexample - cost value is associated with each node…- smoothness constraint - max. distance of neighbor-column nodes <= 1
Find a path consisting of two nodes, one in each column, having the min total cost…
Max vertical distance between neighboring nodes in the path is, say 1… Node A
…called the smoothness constraint.So, the neighbors of node A can only be… Node A
Connect each node to its bottom-most neighbor with a directed edge …
We build vertical edges along each column, pointing downwards.
Along each column, subtract the cost of each node by that of the node beneath it... -1 – 2 = -3 2 – 1 = 1 1 – 8 = -7 unchanged
If the cost sum of the bottommost 2 vertices is nonnegative, make the sum negative… 3 – 11 – 1 = -9 Sum: 3 + 8 = 11 > 0
Next, we will compute the minimum cost closed set of this graph…
The minimum cost closed set problem can be solved by a Maximum Flow algorithm…
We try to compute max amount of water that can flow from the source to the sink…
s is connected to the negative-cost nodes. Pipe capacities are determined by… 3 = |-3| 9 = |-9|
Similarly, t accepts pipes from the nonnegative-cost nodes...
Try to find paths from s to t, and push the bottleneck amount of flow through it…
After we push a flow, some pipes may become saturated (allowing no more flow).
The potential for reverse flow is increased, build pipes allowing water to flow back…
Saturated pipes can be removed.We continue to discover new s-t paths…
Remove all saturated pipes, and we cannot find any path from s to t now…
Find the nodes that can be reached from the source, and the minimum-cost closed set is identified.
The upper envelope of the min-cost closed set is the solution.
3D Surface • The surface intersects with exactly one voxel of each column of voxels parallel to the z-axis • The difference in z-coordinates between neighboring voxels on a valid surface in x and y directions • smoothness constraint (∆x, ∆y)
3-D Case • Principles presented in 2-D are applicable to 3-D • Detect a surface instead of a path • Construct Edges in both x- and y-directions • x- and y-direction may have different smoothness constraints z y x
Implementation Issues • Selection of min s-t cut algorithm is critical • Theoretically most efficient: the push-relabel algorithm • Better performance in practice: Boykov-Kolmogorov algorithm (2002) • Memory efficiency is important as well • Adjacency-list and Forward-Star graph representations are not memory-efficient • Implicit-edge graph representation
Experimental Methods • Phantoms • 66 computer-generated phantoms for execution time and memory usage evaluation • 72 CT-scanned images of physical phantoms of known sizes for segmentation accuracy measurement • Hundreds of others for verifying various modeling techniques used in the algorithm • Airways • 12 in vivo pulmonary CT scans of 6 human subjects • 6 TLC (85% lung vol.), 6 FRC (55% lung vol.) • Image Size: 512 x 512 x (500 to 600) • Resolution: 0.7 x 0.7 x 0.6 mm3 • 317 airway segments (4212 slices)
Execution Speed • Image size: 20 x 20 x 20 – 300 x 300 x 300 • AMD Athlon 1.7 GHz
Accuracy Evaluation in Phantoms • Signed error: • Slice-by-slice DP : -0.02 0.11 (mm) • Our approach : -0.01 0.10 (mm) • Unsigned error: • Slice-by-slice DP : 0.09 0.07 (mm) • Our approach : 0.08 0.07 (mm) • Unsigned error significantly smaller than Slice-by-slice DP by t-test (p < 0.001)
Airway Segmentation • Visually compared 100 randomly selected results to slice-by-slice DP • Better : 45 • Equivalent : 52 • Both failed : 1 • Uncertain : 2 • Mean major diameter of results by slice-by-slice DP significantly larger than 3-D approach (p<0.01)