Analyzing Link Structures in Large-Scale Semantic Networks: Growth Models and Behavioral Effects
This study explores the link structures of semantic networks, assessing small-world and scale-free properties. It examines the collaboration networks of film actors and scientists, as well as the neural network of C. elegans. By investigating the implications of semantic growth, including age-of-acquisition effects and behavioral outcomes, the research proposes that power-law distributions are indicative of semantic development. A growing network model is presented, elucidating how word associations form based on frequency and semantic similarity, and highlighting the interplay between lexical development and network connectivity.

Analyzing Link Structures in Large-Scale Semantic Networks: Growth Models and Behavioral Effects
E N D
Presentation Transcript
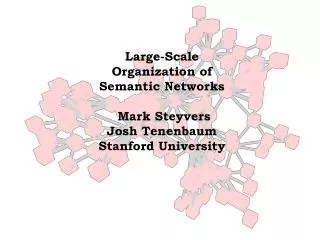
Large-Scale Organization of Semantic Networks Mark Steyvers Josh Tenenbaum Stanford University
Graph theoretic analyses: • Collaboration network of film actors, scientistsWatts & Strogatz (1998); Newman (2001) • Neural network of worm: C. elegans Watts & Strogatz (1998) • WWW Barabasi & Albert (1999)
Overview • Link structure of semantic networks: Small-world & scale free • What produces such link structures? Semantic growth • Relation to age-of-acquisition effects • Behavioral effects of link structure
Word AssociationNelson et al. (1999) nwords = 5,000+
Roget’s Thesaurus Categories 1,000 Word forms 29,000+
WordnetGeorge Miller Word senses 99,000+ Word forms 122,000+
3.03 10.61 5.43 2. Local clustering C = .186 .029 .875 Random Graphs .004 .000 .613 - - - 3 x number of triangles number of connected triples of vertices C=0 C=1 One class of Small World Networks: Word Association Roget WordNet 1. Short path lengths L = average length of 3.04 10.6 5.6 shortest path between two nodes n = number of nodes 5018 200,000+ 30,000+ 3. Power-law g = exponent in power-law 3.01 3.19 3.11degree distribution distribution
Power law: Exponential: HUBS e.g., random graphs (Erdös-Réyni) orWatts & Strogatz (1998) model Power law tail Exponential tail
g=3.01 g=3.19 g=3.11
Slope in rank plot a=.466 Adamic (2000): g=1+1/a Slope in distribution plot g = 3.15 Zipf’s (1949) “Law of Meaning” #meanings Word frequency rank
Overview • Link structure of semantic networks: Small-world & scale free • What produces such link structures? Semantic growth • Relation to age-of-acquisition effects • Behavioral effects of link structure
H.A. Simon (1955). Power laws in distributions: • Scientists by number of papers published • Cities by population • Income by size -> “rich get richer” growth-like stochastic process • Barabasi et al. (1999). Power laws in WWW • in-degree & out-degree -> growth processes
Proposal: Power-law degree distributions in semantic networks are signature of semantic growth • within individual; lexical development • across speakers; language evolution Disclaimer: We will not describe in detail any specific psychological mechanism
Growing Network Model • Representation: • Nodes represent words or concepts • Edges represent semantic relations or associations • Variables: • ki = degree of node i • ui = utility of node i based on word frequency:
Start with small fully connected network with M nodes • A new node is inserted: • Choose a local neighborhood i • (a neighborhood i of a node is formed by node i and its neighbors) • Make M connections into neighborhood • repeat n times until network is large enough
Preferentially make M connections to nodes with high utility: 2 2.1 new node 3.4 .6 2.1 1.5 2.3 .2 Preferentially choose large neighborhoods: 1 2 2 new node 6 3 4 3 5 3 3 2
Barabasi & Albert (1999) Model 5018 22 2.85 .020 2.83 Growing Network Model WordAssociation n 5018 5018 <k> 22 22 Path LengthL 3.04 2.84 (.04) ClusteringC .186 .185 (.007)coefficient Power-Lawg 3.01 2.86 (.077)coefficient
Power-laws in non-growing semantic representations?
Hawaii relax volcano lava soothe ache Convert LSA space to graph by variable thresholding on similarity measure • LSA: Latent Semantic Analysis • e.g., Landauer & Dumais (1997) • Analyzed co-occurrence statistics in a large corpus • Placed 60,000+ words in 300-dimensional space • Good semantic neighbors
Tversky & Hutchinson (1986) • Low dimensional geometric models are not suitable for representing conceptual similarity relations; upper bound on the number of points that • can share the nearest neighbor
No good semantic neighborhoods volcano -> was -> head -> ache (word association: volcano->hawaii->relax->soothe->ache) or tick -> tock -> made -> wonderful -> universe (word association: tick -> dog -> master -> universe) Ferrer & Solé (submitted): Connect two words if they co-occur within a small contextual window Slide window over large corpus
Overview • Link structure of semantic networks: Small-world & scale free • What produces such link structures? Semantic growth • Relation to age-of-acquisition effects • Behavioral effects of link structure
Age of acquisition (AoA) effects • Naming and lexical decision tasks • Carroll & White (1973); Brysbaert et al. (2000) • Locus of AoA effects? • Brown & Watson (1987); Lambon Ralph et al. (1998) • AoA is really cumulative frequency effect? • Lewis, Gerhand & Ellis (1999) • Need framework to understand AoA effects.
t=1…15 t=16…50 t=51...150 Prediction of model: early acquired nodes have more connections. Do words acquired early in life have more connections?
Language Evolution Words acquired early in English language are words with high degree (work in progress)
Overview • Link structure of semantic networks: Small-world & scale free • What produces such link structures? Semantic growth • Relation to age-of-acquisition effects • Behavioral effects of link structure
Naming and lexical decision latencies Behavioral effects of structural variables Degree-centrality centrality Authority (Eigenvector-centrality) Proposal: In cognitive system, search is biased toward facts, concepts or words with high centrality
Semantic Dementia Hodges & Patterson (1995)
Conclusion Conclusion • Link structure of semantic networks: • shows non-trivial patterns • shows signature of growth processes • “rich get richer” • respecting local neighborhoods • is relevant for search strategiescentral words might be searched first. • Paper will be available at www-psych.stanford.edu/~msteyver
But… Early acquired words become more central in your model but maybe Words that are more central are acquired earlier