Download
1 / 16
160 likes | 181 Views
A guide for organizing and conducting science experiments in your notebook. Includes step-by-step instructions and examples.

E N D
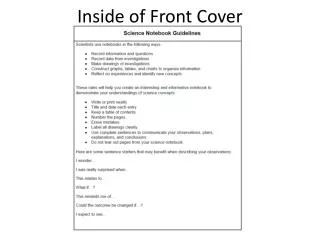
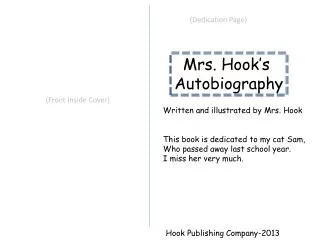
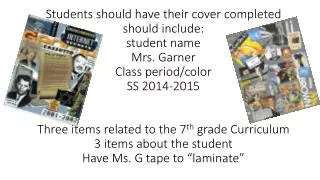
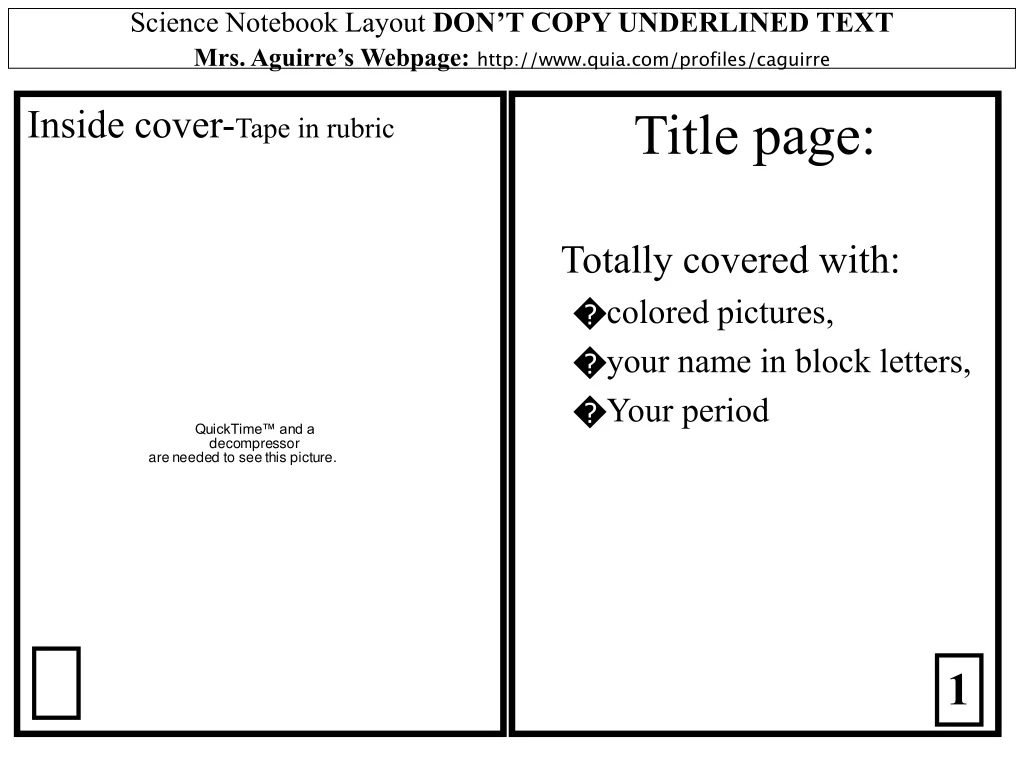
Inside cover-Tape in rubric Title page: Totally covered with: colored pictures, your name in block letters, Your period Science Notebook Layout DON’T COPY UNDERLINED TEXTMrs. Aguirre’s Webpage:http://www.quia.com/profiles/caguirre 1
Tape in Multiple Intelligences Graph Tape in Thinking Processes Handout Science Notebook Layout DON’T COPY UNDERLINED TEXTMrs. Aguirre’s Webpage:http://www.quia.com/profiles/caguirre 2 3
Leave blank for now Table of Contents Science Notebook Layout DON’T COPY UNDERLINED TEXTMrs. Aguirre’s Webpage:http://www.quia.com/profiles/caguirre 4 5
Analysis of Doing Science- 9/10/10 Magnetic Diver 9/9/10 A. Question: What makes the diver go up and down? B What we already know: The diver moved when…. C. Hypothesis: The magnet attracts the diver and makes it sink BECAUSE…... Skip 1 line D.Record basic observations of the behavior of the diver. Record at least three questions about the diver. Science Notebook Layout DON’T COPY UNDERLINED TEXTMrs. Aguirre’s Webpage:http://www.quia.com/profiles/caguirre E. Conclusion The diver goes up or down because of ……. My evidence/data for this is the observation that…. My initial hypothesis was (right or wrong) because… F. Write and draw out your explanationof how the diver works Near each heading on the diagram, label what you did when testing the Diver on the diagram. Draw pictures in color showing the process you used to find the answer (what you did) 6 7
USING PHOTOGATES TO TIME CARS 9/16/10 Top half of page: Draw/color a labeled picture of how to set it up. Label: ramp, car, photogate A,B, draw red and blue wires. Copy and answer in a paragraph- bottom half of page. How should the photogates be set up for timing cars: 1. Should the timer be on stopwatch or interval? 2. Should light A, B or both be on? 3. Which photogate should be nearest to the top of the ramp, A or B? Using Timers 9/14/10 Science Notebook Layout DON’T COPY UNDERLINED TEXTMrs. Aguirre’s Webpage:http://www.quia.com/profiles/caguirre 8 9
Variables 9/22/10 2. Do the results of the 2nd trial agree with the hypothesis better than the 1st trial? Explain why.. Timing Cars 9/16/10 Science Notebook Layout DON’T COPY UNDERLINED TEXTMrs. Aguirre’s Webpage:http://www.quia.com/profiles/caguirre An Illustrated Guide to Variables Draw a picture of the ramp system. Label and explain what the experimental, dependent, and control variables are- do not forget labels!! Include WHY control variables are important 10 11
Science Notebook Layout DON’T COPY UNDERLINED TEXTMrs. Aguirre’s Webpage:http://www.quia.com/profiles/caguirre Graph of Data- 9-28-10 Marble Motion 9-24-10 Question: Does increasing the mass of a car make it go down a ramp faster? Skip 1 line Hypothesis: If we increase the mass of the car, it will ……………. Skip 1 line Experimental Variable: Weight of car (# of marbles) Dependent Variable: measure time to get from A to B • A good graph has: • Descriptive Title • Axes labelled • Line drawn Data Table: Conclusion Paragraph: must have Topic sentence Answers the question Explain how data was collected (averages) Does data support hypothesis? Why or why not? How and why were variables controlled (to make it a fair test?) Some sort of concluding sentence 12 13
Loop Flyer- Graph and conclusions 10-1-10 Conclusion: Which was the best design and why? Paragraph needs to include: Topic sentence answers the problem Design ____ flew best with an average distance of ____ cm. Design ____ only flew an average distance of ____ cm. My hypothesis was ____________ because ………. Explain your hypothesis and the changes you made. Describe which design flew better and why you think this happened What variables did you control Which variables were difficult to control…. Did these interfere with your tests- how you might correct this if you could. Loop Flyer Lab- 9-29-10 Background Information: I think best flight is….. Because…..(use only two lines) Science Notebook Layout DON’T COPY UNDERLINED TEXTMrs. Aguirre’s Webpage:http://www.quia.com/profiles/caguirre Hypothesis: I think design ___ will fly farther because….. (use descriptive ideas to describe your design change to the flyer) 14 15
Unit Reflection: Ice Cream Heat and Changes in Matter “The Chemistry of Ice Cream” Science Notebook Layout DON’T COPY UNDERLINED TEXTMrs. Aguirre’s Webpage:http://www.quia.com/profiles/caguirre If all matter is made of molecules, what makes solids melt and liquids freeze? If all matter is made of molecules, what makes solids melt and liquids freeze? Use the top half of the page to respond to this question- use words and pictures to show me what you know. Use the top half of the page to respond to this question again- use words and pictures to show me what you know, and what you learned throughout the unit. .Look back at your notebook pages (17- 29) for ideas of what to write and draw. In each box, include two facts and a picture 16 17
Conclusion : Label paper cups: R and B for red and blue. Mark a line about 1/3 of the way from bottom Put 1 level tsp of each mix in your cups. Test the aroma (use correct technique) and appearance of each. Record ratings. Use the toothpick to taste each dry mix. Record ratings. Mix with water: Recipe Don't mix up the spoons.1 level tsp. powder + 1/3 of the small cup of warm water.STIR WITH TOOTHPICK!! Analysis of cocoa lab The experimental variable is __________ Variables we Made the Test Controlled: Unfair: 3. How could bias influence the outcome of the cocoa lab? 4. Assume 2 brands of cocoa-explain how we could have done an experiment that was not biased. List at least 3 things we SHOULD have done so as not to be biased Include ways to make it a “blind taste test”. PICTURES!! Tape in Cocoa Lab WS Science Notebook Layout DON’T COPY UNDERLINED TEXTMrs. Aguirre’s Webpage:http://www.quia.com/profiles/caguirre Use 6 lines ONLY!! 18 19
Science Notebook Layout DON’T COPY UNDERLINED TEXTMrs. Aguirre’s Webpage:http://www.quia.com/profiles/caguirre Dance of the Molecules Draw the molecules in each state (see instructions bottom of Page 21 Explain the motion of the molecules in each state 20 21
Science Notebook Layout DON’T COPY UNDERLINED TEXTMrs. Aguirre’s Webpage:http://www.quia.com/profiles/caguirre 23 Squ eeeee zing molecules Problem: How does the volume of matter change if pressure is increased? Info we have: Particle theory of matter solid liquid gas Hypothesis:Look at your pictures above: What will happen to the volume of each as books are piled on (give % eg 100%, 0%, 50%, ? Give a reason for each. Gas (air): The volume will be ____ % because____ Liquid (water): The volume will be ____ % because____ Solid (ice): The volume will be ____ % because____ 22 Data Analysis: What percent of the volume of each remains after pressure is increased? Gas (air): Percent = ----- x 100 = Liquid (water): ----- x 100 = Solid (ice): ----- x 100 = Conclusion: Gas: 3 lines max EXPLAIN WHY THE VOLUME CHANGED. Use reasons from your notes on pages 35-36 Include: how CLOSELY PACKED THE MOLECULES MUST BE. Underline the word molecules Liquid: 3 blank lines Solid: For each (solid, liquid), EXPLAIN WHY THE VOLUME DIDN’T CHANGE. Use reasons from your notes on pages 35-36. Include: how CLOSELY PACKED THE MOLECULES MUST BE. Underline the word molecules. Conclusion: The most surprising conclusion from this experiment was… Look at your hypothesis! Picture Draw the syringes with 4 books. Include numbers to show volumes with 4 books for solid, liquid, and gas. 23 22
InterMolecular Forces- p96 Science Notebook Layout DON’T COPY UNDERLINED TEXTMrs. Aguirre’s Webpage:http://www.quia.com/profiles/caguirre Detecting Molecular Motion In EACH box- a summary and a colored picture 25 24
Science Notebook Layout DON’T COPY UNDERLINED TEXTMrs. Aguirre’s Webpage:http://www.quia.com/profiles/caguirre Magic Shell Graph My melting/freezing point was:_______________ Magic Shell Lab- 10/26/10 Problem: What is the freezing/ melting point of Magic Shell? Information: A)The freezing point of water is __˚C. B)The melting point of ice is ___˚C: C) The melting point of a substance is the SAME as the ___________ point. Hypothesis: I think the magic shell will freeze at ….. Because….. Roles: my role is___________ Magic Shell Discussion 1) Look at the temperatures you recorded as you cooled the shell topping. It will seem almost as if the mixture “stalled” at a certain temperature. What is this temperature? 2) Look at the temperatures you recorded as you heated the shell topping. Is the “stalled” temperature about the same as it was when you cooled the mixture? 3. See next page for graph of magic shell 3) Make a cooling curve graph and a heating curve graph. Place time on the x axis and temperature on the y axis. Label the area of your cooling graph where freezing occurred. Label the area of your heating graph where melting occurred. 4. When you cooled and then heated the shell topping, the temperature “stalled.” What was happening at this temperature? 5. What would magic shell topping be like if the freezing/melting point was 20 °C? 6. What about if the freezing/melting point was 0 °C? 26 27
Science Notebook Layout DON’T COPY UNDERLINED TEXTMrs. Aguirre’s Webpage:http://www.quia.com/profiles/caguirre Temp. Time It’s Freezing Discussion Ice Cream!!! Predict how the temperature will change as your ice cream freezes. Ice only Line Ice and salt Line It’s Freezing Question: Does adding salt change the temperature of ice? Information: We used salt in making the ice cream We use salt on roads to melt ice. Hypothesis: I think that adding salt to ice will make the temperature……… BECAUSE…….. Data Analysis: • 1. What happened after you added the salt to the ice? Was the temperature above or below the ice only? • 2. What is the only factor that could have caused the changes shown in question 1? What does this tell you about the freezing point temperature of salt water compared to fresh water? • Use page 260 to give explanation. • 3. Heat energy is needed to change phase from a solid to a liquid. List the possible sources of the heat needed for this phase change in your beaker. • Use page 260 to give explanation. • 4. Explain how we could use the information we found out • about temperature changes in salt water in this experiment to make ice cream. • 5. In the radiator of your car you put a combination of antifreeze and water to keep your car engine cool in the summer and prevent the radiator from freezing in the winter. Explain how you think this works in terms of what you saw in the experiment you just did. • Use page 261 to give explanation. 28 29