PETROLEUM REFINING
PETROLEUM REFINING. AGENDA. Introduction Industry Overview Risk Analysis Company Analysis Valero Energy Corporation Provident Inter Pipeline Conclusion Recommendations . INDUSTRY OVERVIEW. Main Sector in Oil and Gas Industry. Petroleum Refining.

PETROLEUM REFINING
E N D
Presentation Transcript
AGENDA • Introduction • Industry Overview • Risk Analysis • Company Analysis • Valero Energy Corporation • Provident • Inter Pipeline • Conclusion • Recommendations
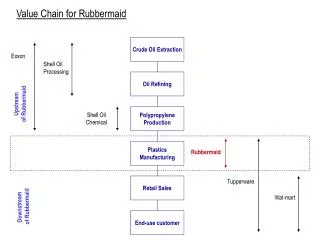
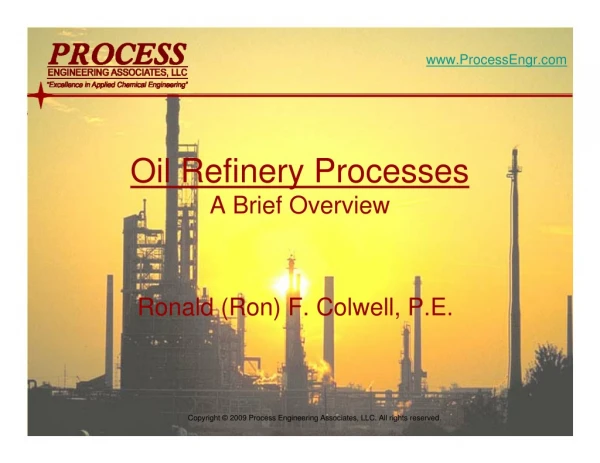
Petroleum Refining • A refinery takes a raw material (crude oil) and transforms it into petrol and hundreds of other useful products. • What refining does: • Adjusts and reshapes molecules • Standardizes product • Removes contaminants to meet requirements for: • end-user performance • environmental regulations
Main Processes • All refineries perform three basic steps: • Separation: fractional distillation) • Conversion: cracking and rearranging the molecules • Treatment: blending, purifying, fine-tuning and improving products to meet specific requirements
Refineries in Canada Thousand of Cube Meters per day in 2007
Refining Capacity Changes for Integrated Majors IMPLICATIONS:DOWNSTREAM DIVESTMENTS • Integrated majors continuing to exit refining business – some through divestment of refining assets and some through spinning off of Downstream business as a separate corporate entity. • Result is that refinery ownership is moving away from integrated majors towards non-integrated companies. • To remain viable, refining businesses will need to be able to generate sufficient cash to provide an adequate return to their owners
Refinery Margin and Major Costs • Refining margin = total value of petroleum products - the price of the raw material-other costs • Major Costs • Fixed operating costs: labour, maintenance, taxes and overhead costs • Variable operating costs: feed-dependent costs for power, water, chemicals, additives, catalyst and refinery fuels beyond own production • Transport costs • Marginal crude freight • Insurance and ocean loss • Applicable fees and duties
Regional Refining Margins $/barrel
Green House Gas Regulation • EPA has started to propose regulation of GHG’s under existing CAA programs such as Vehicle Emissions standards rule, Prevention of Significant Deterioration, and New Source Performance Standards • Under these regulations, permits will be required for projects that emit threshold levels of CO2 (regardless of emissions of other criteria pollutants such as SOx, NOx, etc.
Implications • Significantly more permits will be required for refinery modifications • Require installation of BACT (Best Available Control Technology) for managing CO2 emissions. BACT to be determined on case-by-case basis. • EPA is currently working on approach for refinery GHG measures: Energy managementCommand and control (source specific emission limits) Benchmarking • In any case, greater focus on energy reduction projects will likely be required.
Reformulated Fuel Standard (RFS2) • RFS program was created under the Energy Policy Act of 2005. Established first renewable fuel mandate – 7.5 billion gallons by 2012 • Established new categories of renewable fuel and mandates for each, and increased volumes of renewable fuel (9 billion gallons in 2008 to 36 billion gallons by 2022)
Implications • Growth in biofuels exceeds overall growth in transportation fuels – increased pressure on refining • Significant expansion in facilities required to manufacture, store, transport, and blend biofuels • Impact of increasing biofuels volumes will result in changes to mix of fuel blending components – refinery configuration and/or new technologies
Other Regulations • Clean Air Act • Dominant regulatory effect on refinery operations • Reformulated gasoline (RFG) standards • Affects operations indirectly through restrictions on product mix • Clean Water Act • RCRA • State regulations • Corporate Average Fuel Economy (CAFE) standards • Indirect effect through performance requirements on products
Risk Exposure • Operational Risk • Environmental Consideration • Economic and Political Risk • Commodity Risk • Financial Risk • Regulatory Limitations • Limitation on Capacity
Environmental Impacts and Risks • Air Refinery emissions contain several major ozone precursors. The associated impacts would be most significant near and downwind of a given facility. • Water and soil Potential for contamination from leaks and spills • Carcinogens Benzene is a significant component of refinery air emissions • Global warming
Future Regulation: Waxman-Markey Legislation • Market Environment Characterized by Rising Regulatory Costs and Excess Capacity Abroad • Rising costs of production from recently enacted environmental and regulatory requirements. • Rising competition from foreign competitors – 7.6 – 8.8 million barrels per day (mb/d) of new refining capacity is expected to come online by 2015 – 80% of which will be built outside of the OECD. Flat or declining demand for transportation fuels in the U.S. market. • Rising taxes, and biofuel mandates will further shrink margins and place 2.5 mb/d of the current 17.5 mb/d of domestic operable capacity at high risk of permanent closure early in the 2015-2030 forecast period.
Implications Gasoline Prices • In the 2015-2030 gasoline prices could rise by an average of $0.20 to $0.40 per gallon under the carbon costs calculated by the U.S. Environmental Protection Agency (EPA). • Gasoline, and all other petroleum based transportation fuels, could rise by over $1/gallon under some CO2 allowance cost forecasts by the U.S. Energy Information Administration (EIA).
Risk Measurement • Sensitivity analysis • Simulation Analysis • Probability Estimation • Value at Risk (VaR)
Risk Management • Diversification and Insurance • OTC Forward Contracts • Exchange-Traded Energy Futures • Foreign Exchange Futures • Hedging through Options
Overview • Fortune 500 company based in San Antonio, Texas • Incorporated in 1981 – Valero Refining & Marketing Company • Changed name in 1997 to Valero Energy Corporation • 22,000 employees
Executives Bill KlesseChairman of the Board, CEO and President Started out as chemical engineer BSciChemEng MBA in Finance Mike CiskowskiExecutive Vice President and Chief Financial Officer Responsible for Treasury, Finance, Accounting, Internal Audit, Trading Controls and Insurance BBA & MBA in Finance • Jay BrowningSenior Vice President-Corporate Law and Secretary • Responsible for Corporate Governance, Finance, Securities and Exchange Commission, and Information Systems Support. • BBA & MBA in Finance • Donna TitzmanVice President and Treasurer • Responsible for the company’s banking, cash management, customer credit and investment management areas. • BBA Accounting, CPA
Segments • Refining • Refining operations, wholesale marketing, product supply and distribution, and transportation operations • Ethanol • Sales of internally produced ethanol and distillers grains • Our ethanol operations are geographically located in the central plains region of the U.S. • Retail • Company-operated convenience stores, Canadian dealers/jobbers, truckstop facilities, cardlock facilities, and home heating oil operations. • Segregated into Retail-US and Retail-Canada
Competitors 2010 Refining Capacity in USA
Gross margin: 9.2% Operating margin: 3%