Download
1 / 29
300 likes | 579 Views
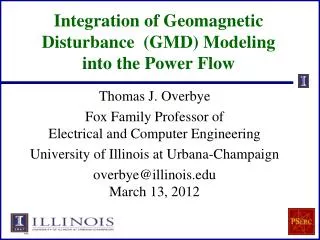
Integration of Geomagnetic Disturbance (GMD) Modeling into the Power Flow . Thomas J. Overbye Fox Family Professor of Electrical and Computer Engineering University of Illinois at Urbana-Champaign overbye@illinois.edu March 13, 2012. Overview.

E N D
Integration of Geomagnetic Disturbance (GMD) Modeling into the Power Flow Thomas J. Overbye Fox Family Professor of Electrical and Computer Engineering University of Illinois at Urbana-Champaign overbye@illinois.eduMarch 13, 2012
Overview • Geomagnetic disturbances (GMDs) have the potential to severely disrupt operations of the electric grid, yet power engineers currently have few tools to help them assess the impact of GMDs on their systems • Goal of the this work is to perform the research necessary to help move GMD assessment into the realm of power system planning and operations engineers • Guiding motto: “All models are wrong but some are useful,” George Box, 1979 • GIC impact is certainly still an area of research, but power engineers need tools to consider its impact on their systems
NERC Interim GMD Report • On February 29, 2012 NERC issued an Interim GMD Report • available at http://www.nerc.com/files/2012GMD.pdf • In section I.10 of the Executive Summary there are four high level recommended actions • Improved tools for industry planners to develop GMD mitigation strategies • Improved tools for system operators to manage GMD impacts • Develop education and information exchanges between researchers and industry • Review the need for enhanced NERC Reliability Standards • I hope this project helps with at least the first 3 of these
My Background in GMD • My interest comes from PSERC’s DOE funded “The Future Grid to Enable Sustainable Energy Systems” project • In June 2011 I attended the JASON GMD briefing • Realized GMD calculations could added to the power flow • Implemented these calculations in PowerWorld Simulator while working there full-time in summer 2011 • Presented results in November 2011 at NERC’s Geo-Magnetic Disturbance Task Force; based on feedback changed GMD modeling approach • In 2012 started EPRI large-scale system study and also working with several other utilities for studies
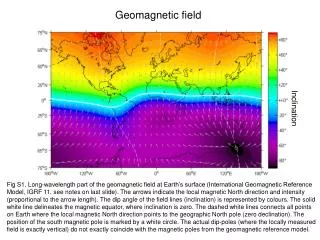
Geomagnetic Disturbances (GMDs) • Solar events can cause changes in the earth’s magnetic field (i.e., dB/dt). These changes in turn produces an electric field at the surface • Changes in the magnetic flux are usually expressed in nT/minute; from a 60 Hz perspective they produce an almost dc electric field • 1989 North America storm produced a change of 500 nT/minute, while a stronger storm, such as the one in1921, could produce more than 5000 nT/minute variation • Storm “footprint” can be continental in scale, for example covering much of the U.S. • For reference, Earth’s magnetic field is normally between 25,000 and 65,000 nT, with higher values near the poles Image source: J. Kappenman, “A Perfect Storm of Planetary Proportions,” IEEE Spectrum, Feb 2012, page 29
March 8-9, 2012 “Event” • Forecasted solar storm last week was not nearly as large as some thought (graph is dB/dt at Ottawa, 45.4N) Less than100 nT/minute,compared to 500 nT/minute forthe 1989 event and5000 in 1921 Image source: www.intermagnet.org/apps/plt/plot_result_int_e.php
Electric Fields and Geomagnetically Induced Currents (GICs) • As described by Faraday’s law, changes in the magnetic flux intensity produce a (non-uniform) electric field on the surface; values are impacted by ground conductivity • Electric fields are vectors with a magnitude and direction; values are usually expressed in units of volts/mile (or volts/km); • A 2400 nT/minute storm could produce 5 to 10 volts/mile. • The electric fields cause geomagnetically induced currents (GICs) to flow in electrical conductors such has the high voltage transmission grid • From a modeling perspective the induced voltages that drive the GICs can be modeled as dc voltages in the transmission lines. • The magnitude of the dc voltage is determined by integrating the electric field variation over the line length
Power System Impacts of GICs • The dc GICs are superimposed upon the ac currents. In transformers this can push the flux into saturation for part of the ac cycle • This can cause largeharmonics; in the positive sequence(e.g., power flow and transient stability) theseharmonics can be represented by increased reactive power losses on the transformer.
Mapping Transformer GICs to Transformer Reactive Power Losses • Transformer specific, and can vary widely depending upon the core type • Single phase, shell, 3-legged, 5-legged • Ideally this information would need to be supplied by the transformer owner • Currently support default values or a user specified linear mapping • For large system studies default data is used when nothing else is available. Scaling value changes with core type • Still debate in the industry with respect to the magnitude of damage GICs would cause in transformers (from slightly age to permanently destroy)
The Impact of a Large GMD From an Operations Perspective • There would be a day or so warning but without specifics on the actual magnitude • It could strike quickly (they move at millions of miles per hour) with rises times of less than a minute, rapidly covering a good chunk of the continent • Reactive power loadings on hundreds of transformers could sky rocket, causing heating issues and potential large-scale voltage collapses • Power system software like state estimation could fail • Control room personnel would be overwhelmed • The storm could last for days with varying intensity • Waiting until it occurs to prepare might not be a good idea Image source: J. Kappenman, “A Perfect Storm of Planetary Proportions,” IEEE Spectrum, Feb 2012, page 29
GMD Enhanced Power Analysis Software • By integrating GIC calculations directly within power analysis software (like power flow) power engineers can readily see the impact of GICs on their systems, and consider mitigation options • GIC calculations use many of the existing model parameters such as line resistance. But some non-standard values are also needed; power engineers would be in the best position to provide these values, but all can be estimated when actual values are not available • Substation grounding resistance, transformer grounding configuration, transformer coil resistance, whether auto-transformer, whether three-winding transformer, generator step-up transformer parameters
GIC G-Matrix • With knowledge of the pertinent transmission system parameters and the GMD-induced line voltages, the dc bus voltages and GIC flows can be calculated by solving a linear equation I = GV • The G matrix is similar to the Ybus except 1) it is augmented to include substation neutrals, and 2) it is just conductances • The current vector contains the Norton injections associated with the GMD-induced line voltages • Factoring the sparse G matrix and doing the forward/backward substitution takes about 1 second for the 62,600 bus Eastern Interconnect Model
Four Bus Example The line and transformer resistance and current values are per phase so the total. Substation grounding values are total resistance. Brown arrows show GIC flow.
Determining GMD Storm Scenarios • The starting point for the GIC analysis in the power flow is an assumed storm scenario; this is used to determine the transmission line dc voltages • Matching an actual storm can be complicated, and requires detailed knowledge of the associated geology • Feb 2012 NERC report recommended for planning purposes a similar approach could be used • Uniform electric field: All locations experience the same electric field; induced voltages in lines depend on assumed direction • Maximum value in 1989 was 1.7 V/km (2.7 V/mile) • We also consider a more detailed non-uniform model • Non-uniform electric field: Magnitude of electric field varies according a some function; induced voltages in lines depend on magnitude and assumed direction
East-West (90 Degrees) Non-uniform GMD Scenario, Centered at 42N, 88.5W; 5 volt/mile
NE-SW (45 Degrees) Non-uniform GMD Scenario, Centered at 42N, 88.5W; 5 volt/mile
Integrated Geographic Information • The potentially time-varying GMD induced dc voltages are determined by knowing the latitude and longitude of the transmission lines • Just knowing the geo-coordinates of the terminal buses should be sufficient • Hence buses need to be mapped to substations, and substations to their geo-coordinates • For this project substation/geographic data was supplied by PowerWorld • Buses mapped to substations; note bus numbers do vary even within cases in a particular “series” like the 2010 MMWG cases • Latitude and longitude provided for substations • Data can easily be imported/exported
Impact of Electric Field Angle on GICs • As mentioned earlier, the resultant GICs depend upon the electric field angle; different angles have different system impacts • The results shown to the right give the transformer Mvar GIC-induced losses by area in the Eastern Interconnect (using pseudo-IDs for confidentiality) assuming a uniform 2 V/mile field.
Getting Access to the Results • GIC studies involve the traditional power system results (voltages, flows, etc.), along with a new set of variables such as • Estimated parameters, such as substation grounding and transformer coil resistance • Substation neutral dc voltages • Bus dc voltages • GIC flows in branches • GIC induced reactive power losses in transformers • Providing users with easy access to the results/data is key, as is good wide-area visualization
Per Unit Voltage Drops Caused by East-West 5V/mile GMD Storm Scenario These results are just illustrative. Actualmodel parameters willhelp give better results.
Power Flow Convergence Issues • Integrated GIC modeling can certainly impact power flowconvergence since the GIC induced reactive power losses simultaneously add lots of reactive power. • Several techniques can help prevent divergence • Just calculating the GICs without solving the power flow • Not calculating GMD induced voltages for equivalent lines • Gradually increasing the assumed electric fields to avoid simultaneously adding too much reactive power at one time • Only calculating the GIC transformer reactive power losses for specified areas; reactive power doesn’t tend to travel far • Freezing the transformer taps and switched shunts in certain problematic areas • Solving in transient stability for a gradually increasing GMD
Integrating GIC Calculations into Power System Planning • A large GMD could cause substantially different power system flows and voltages • Studies allow for testing various mitigation strategies • Operational (short-term) changes include redispatching generation to avoid long distance power transfers and reducing transformer loading values, and strategically opening devices to limit GIC flows • Longer-term mitigation actions include the installation of GIC blocking devices on the transformer neutrals (such as capacitors) and/or increased series capacitor compensation on long transmission lines • Determining relay settings – when to trip the transformer
Research Example: Should the Lower Voltage Network be Included • NERC report stated with respect to GIC calculations, “Transmission lines below 230 kV are typically not modeled…” • Our research indicates ignoring these low voltage lines might substantially under report the total GIC flows and the associated increase in reactive power loading • For Eastern Interconnect case with a uniform 2.0 volt/mile east-west field the total GIC related reactive power losses are 64,525 Mvar considering all lines, 44,341 Mvar if lines below 150 kV are neglected and just 40,984 if lines below 200 kV are neglected. • No reason not to include these lines since they are in the standard power flow models • Computationally neglecting lines is faster, but the calculations are quite computationally efficient
Research Example: Determining Mitigation Strategies • GIC flows can be reduced both through operational strategies such as strategically opening lines, and through longer term approaches such as installing blocking devices • Algorithms are needed to provide power engineers with techniques that go beyond trial-and-error • Such approaches require a coupling between the GIC calculations and the power flow solutions • For example, determining lines that would 1) substantially reduce the GIC flows and 2) are not crucial from an operational perspective
Small System Operational Mitigation Example • The system on the right shows how the GIC impacts can be reduced by doing generation dispatch to allow opening a 345 kV line • Research is needed to determine optimal solutions
Validation • Validating the GIC models and results is an important area of research • Real-time and historical magnetic field measurements are available at www.intermagnet.org • Readings are available for about 60 locations worldwide • We are working with EPRI using their Sunburst data • We would like to analyze SCADA data to relate transformer neutral flows to changes in transformer losses • Validation is challenging because there are not a lot of measurements, and the GIC flows depend upon system topology, which is often difficult to reconstruct after the fact