Download

1 / 15
150 likes | 244 Views
Discover how Unsupervised Visual Taxonomies outperform Supervised methods for image classification using Gibbs sampling and hierarchical models.

E N D
Unsupervised Learning of Visual Taxonomies IEEE conference on CVPR 2008 Evgeniy Bart – Caltech Ian Porteous – UC Irvine PietroPerona – Caltech Max Welling – UC Irvine
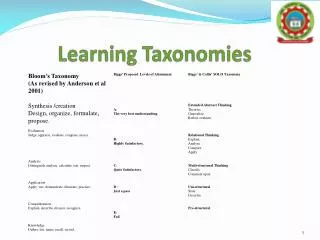
Introduction • Recent progress in visual recognition has been dealing with up to 256 categories. The current organization is an unordered ’laundry list’ of names and associated category models • The tree structure describes not only the ‘atomic’ categories, but also higher-level and broader categories in a hierarchical fashion • Why worry about taxonomies
TAX Model • Images are represented as bags of visual words • Each visual word is a cluster of visually similar image patches, it is a basic unit in the model • A topic represents a set of words that co-occur in images. Typically, this corresponds to a coherent visual structure, such as skies or sand • A category is represented as a multinomial distribution over all the topics
TAX Model • Shared information is represented at nodes :the distribution of category c :a uniform Dirichlet prior of :topic t : a uniform Dirichlet prior of :a level in the taxonomy of detection d in image i :a topic of detection d in image I :the l’th node on the path
Inference • The goal is to learn the structure of the taxonomy and to estimate the parameters of the model • Use Gibbs sampling, which allows drawing samples from the posterior distribution of the model’s parameters given the data • Taxonomy structure and other parameters of interest can be estimated from these samples
Inference • To perform sampling, we calculate the conditional distributions # of detections assigned to node and topic excluding current detection d # of detections assigned to topic z and word excluding current detection d # of images that go through node c in the tree, excluding current image i :# of detections in image i assigned to level l and topic t # of detections assigned to node and topic t, excluding current image i
Experiment 1 : Corel • Pick 300 color images from the Corel dataset • Use ‘space-color histograms’ to define visual words(total 2048 visual words) • 500 pixels were sampled from each image and encoded using the space-color histograms 888 888 888 888
Experiment 1 : Corel • 4 levels, 40 topics • Set • Run Gibbs sampling for 300 iterations
Experiment 1 : Corel R A B 1 2 9 3 4 5 6 7 8
A B
Experiment 2 : 13 scenes • Use 100 examples per category to train the model • Extract 500 patches of size 2020 randomly from each image • Pick 100,000 patches from total 650,000 patches, run k-means with 1000 clusters • The 500 patches of each image is then assigned to the closest visual word • Run Gibbs sampling for 300 iterations • Set
Experiment 2 : 13 scenes • :the probability of a new test image j given a training image i The estimate of the distribution over topics at level l in the path for image i The mean of each topic
Conclusion • Supervised TAX outperforms supervised LDA therefore suggests that a hierarchical organization better fits the natural structure of image patches • The main limitation of TAX is the speed of training. For example, with 1300 training images, learning took 24 hours