Report Card
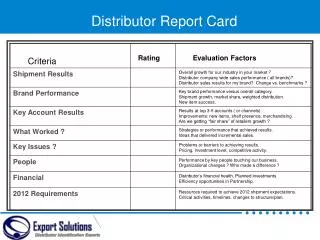
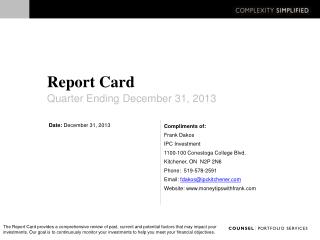
Report Card. Quarter Ending December 31, 2013. Date: December 31, 2013. Compliments of: Frank Dakos IPC Investment 1100-100 Conestoga College Blvd. Kitchener, ON N2P 2N6 Phone: 519-578-2591 Email: fdakos@ipckitchener.com Website: . www.moneytipswithfrank.com.

Report Card
E N D
Presentation Transcript
Report Card Quarter Ending December 31, 2013 Date: December 31, 2013 Compliments of: Frank Dakos IPC Investment1100-100 Conestoga College Blvd. Kitchener, ON N2P 2N6 Phone: 519-578-2591 Email: fdakos@ipckitchener.com Website:.www.moneytipswithfrank.com The Report Card provides a comprehensive review of past, current and potential factors that may impact your investments. Our goal is to continuously monitor your investments to help you meet your financial objectives.
About This Report • Comments in Report Card refer to last three and 12 months. • Market discussions related to indices and do not analyze or reflect personal investments. • We review performance, risk management and overall effectiveness of each sub-advisor and underlying fund manager. • Counsel investment solutions adopt a long-term approach to investing. Each portfolio solution diversified to reflect appropriate: • Asset mix • Geographic allocation • Investment style • Benchmarks for each Counsel investment solution can be found at end of presentation.
Agenda • Market and economic overview • What our investment specialists say • Review of Counsel investment solutions • Benchmarks and Disclaimers
Global Stock Markets: Index Movements • Quantitative easing (QE) continues to influence • Leaders: U.S. and Japan, United Kingdom and Germany – (QE’ing frenzy) • Mediocre: rest of Europe (sense of recovery) • Laggards: China, Brazil (no QE in place – makes commodities weaker; this impacts on commodity based countries like Canada and Australia) • Biggest risk is “recency bias” Performance is calculated using local currency. Data as at: December 31, 2013 Source: Morningstar Direct, Counsel Portfolio Services
1 Year A bi-polar world – those that QE and those that don’t Source: Morningstar • QE + low rates: helped equities (Risk ON) • Fears of reduction in QE: hurt Fixed Income (Risk OFF)
3 Months Source: Morningstar • The fear of large tapering is off the table – equities breathed a large sigh of relief. • The concern is that much of the rise in the equity markets is based on low volumes and large margin debt.
Canadian Dollar Performance CAD vs. U.S. Dollar CAD vs. Euro • China slowing and the Iran/U.S. accord meant oil and geographic risks were lower – this impacted commodity based countries like Canada. • U.S. prospects seemingly looking better helped the U.S. dollar vs. Canadian dollar. • Stability in Europe (no more scares from the weaker nations) helped the euro vs. the Canadian dollar. • Bank of Canada governor has stated that a lower Canadian dollar will support exports – can expect Canadian dollar to go lower. Source: Bank of Canada
Canada: Equities Vs. Bonds The fear of tapering hurt bonds – it’s the uncertainty of what might happen. Yields in equities are greater than fixed income, hence the move to higher yielding equities. Canadian equities also moved up with the momentum of U.S. equities. Fixed income is not only a yielding component of a portfolio but is also an important diversification tool. There is almost always a place for fixed income. Short-term: Equities vs. Bonds Long-term: Equities vs. Bonds Source: Globe and Mail
S&P TSX 60 Total Return S&P TSX Completion Total Return S&P TSX Small Cap Total Return MSCI Canada Growth Index MSCI Canada Value Index. Canadian Market Overview Market Cap Investment Style • Materials - Commodities, especially gold was hurt by the increasing U.S. Dollar. • Utilities were hurt because the yields are lower. • The rest of the market was strong, mainly on the back of buoyancy in the U.S. market. Source: Morningstar Direct Source: Morningstar Direct
S&P 500 Total Return S&P Mid Cap 400 Total Return S&P Small Cap 600 Total Return Russell 1000 Value Index Russell 1000 Growth Index U.S. Market Overview Investment Style Market Cap • Obamacare helped boost Healthcare stocks, especially the insurers. • Liquidity has been the wind behind the sails of the U.S. economy. • Utilities and telecom services performed the weakest because of their lower yields. Source: Morningstar Direct Source: Morningstar Direct Returns measured in U.S. dollar terms
MSCI EAFE Value MSCI EAFE Growth International Market Overview Investment Style • Japan was boosted by their own version of QE, in fact they are ‘QE on steroids’, putting approximately $225 billion instead of the U.S.’s $85 billion into monthly purchases. • China had a marked slowdown that impacted other countries, especially the commodity producing countries like Brazil. • The QE tapering discussion hurt emerging market bonds. • Gold was affected by slowing global growth and a rising perception of U.S. growth. Source: Morningstar Direct Returns measured in Canadian dollar terms
Recency Bias • Definition: the tendency of people to place too much weight on the most recent events. • What just happened will keep happening. • Events from the past might be less important. Example: an Earthquake occurs. People change their buying habits based on the fact that they recently experienced an earthquake; they might buy too many earthquake supplies even though strong earthquakes are quite rare.
Despite all the things thrown at it – S&P 500 moved up as if made from Teflon Source: MYRA Capital
Range-Bound Markets are Typical Markets have been range-bound in 109 of the last 144 years Secular bull runs are a rarity; not the norm After major bull markets, markets trend sideways for a minimum of 15 years U.S. Stock Market 13 Years SOURCE: Sionna Investments 13 years into this consolidation market – best one before this was 15 years – so have about 4 years left in this range bound market
Inflation Adjusted Market Is Not At New Highs Markets have not broken a record when inflation is taken into account Source: Gary Shilling’s Insight January 2014
Margin Debt is getting to concerned levels Chart to Jan 9. 2014 Source: STAWEALTH.COM
Trading volumes have been trending lower, suggesting new buyers may be scarce.
Only the Tech era had higher P/E’s (NTM – Next Twelve Months)
Bear Arguments Fed quantitative easing is over Interest rate rise will kill rally Growth is too weak Corporate profit margins are peaking Business cycle/bull market is getting old Dysfunction remains in Washington A hard landing in China may occur Stocks are in a bubble (valuations too high)
Benign, if Not Bullish for Stock Prices • Monetary Ease (Dovish Fed) • Fiscal Restraint (Falling Deficit) • Big Themes for 2014 • Economic Recovery • Obamacare • Further Fiscal Restraint • Loss of Global Prestige • Mid-Term Elections
Canadian Dividend Equities As we look ahead to 2014, we expect another solid year for the Canadian equity market, but are more cautious on the U.S. market given the rapid price appreciation of the last two years. We believe the U.S. economy is poised to accelerate as the private sector is finally strong enough to withstand stimulus withdrawal and still post 3%+ GDP growth.
Canadian Quantitative Growth Equities Commodities have been a drag on the resource laden Canadian equity market this past year. With the expected improvement in global growth, the free fall in commodity prices should moderate. This assumes no adverse change to China’s current level of GDP growth. Gold remains a concern as investors appear to no longer need the safety gold typically offers due to the improved growth outlook and lack of geopolitical/financial turmoil. North American economies will continue to show signs of improvement. In the U.S., recent gains in housing, consumer confidence and manufacturing will sustain growth going forward. Canada will be a net benefactor from the strengthening U.S. economy. A weaker Canadian dollar will also contribute to Canada’s growth through improved exports.
Global Fixed Income Despite the relatively strong fundamental outlook in many emerging-market countries, we believe the emerging-market asset class is likely to see broad-based bouts of elevated volatility surrounding the issue of Fed tapering. We believe that selecting countries with relatively good fundamentals, avoiding countries with poor fundamentals, and actively managing risk within emerging markets may prove more successful than a passive allocation to emerging markets as an asset class.
Global Dividend For Europe, the challenges of divergent economic profiles being managed under a singular monetary authority remain at the forefront. Although many euro zone nations, especially the weaker southern European countries, appear to be on more solid economic footing, having returned to modest growth, the frailty of those recoveries and weakness in France's large economy are likely to keep European GDP only modestly positive.
Global Real Estate From a real estate perspective the supply side remains limited. Even though the availability of real estate financing was relaxed during 2013 and is more readily available than a year before, particularly in Europe which is still undergoing the deleveraging process, we expect development capacity to be very specific and de-risked, and we do not expect that targeted development activity would bring supply out of balance.
U.S. Small Cap Equity markets have risen consistently over the past year, with a number of market indices approaching record highs. Investors have bid up equity valuations on signs that the global economy was strengthening and on relief that the U.S. Federal Reserve Board would use a measured approach in tapering its quantitative-easing program. The portfolio management team believes rising equity markets have led to an increase in valuation of many businesses, which may not be warranted.
Canadian Small Cap Our outlook for the Canadian small cap sector remains positive. With global economies on a firmer footing, we would expect many companies to benefit from improved demand for their products and services, leading to growth in earnings and cash flows. Should the economy be in a self propelling recovery, this should give the U.S. Fed the leeway to engage in further tapering of Quantitative Easing without alarming investors too much.
U.S. Growth Equities We expect a slightly better backdrop for the U.S. In addition, we expect to see continued economic improvement in Europe and China which should have a positive effect on the global economy. With a more constructive macro outlook, an investment posture that increases the portfolio’s exposure to companies that are leveraged to global growth may be appropriate. We continue to focus on companies with dependable solid top-line growth and visible earnings streams.
Counsel Balanced Portfolio * Target asset allocation weights adjusted following annual review of Counsel portfolios and with the renewal of the Simplified Prospectus. This Portfolio is managed using a multi-manager process. The current sub-advisor or underlying mutual fund managerfor each mandate is listed beside the mandate for which it provides portfolio management / sub-advisory services. This Portfolio invests in underlying mutual funds (which may be managed by Counsel) currently sub-advised by the sub-advisors listed beside each investment mandate. For information on the underlying funds, please refer to the Simplified Prospectus, which is available on our website at www.counselservices.com or on the SEDAR website at www.sedar.com.
Counsel Balanced Portfolio Effective Asset Class Mix Effective Top 10 Sector Allocation Effective Geographic Mix
Counsel Balanced Portfolio Positive and negative attribution for Q4 2013 Positive and negative attribution for the 12 months ended December 31, 2013 + Positive attribution to overall Portfolio, reflecting that the mandate outperformed its relative benchmark on a gross returns basis. - Negative attribution to overall Portfolio, reflecting that the mandate underperformed its relative benchmark on a gross returns basis.
Counsel Short Term Bond Effective Investment Mix Effective Bond Maturity
Counsel Fixed Income Effective Investment Mix Effective Bond Maturity
Counsel Canadian Value Effective Asset Class Mix Effective Top 10 Sector Allocation
Counsel Canadian Growth Effective Asset Class Mix Effective Top 10 Sector Allocation