Download
1 / 36
360 likes | 371 Views
This summary explores regression analysis to predict low birthweight babies and the importance of the regression line in data summarization. It discusses the best line to represent the data and evaluates the accuracy of the regression line in predicting birthweight.

E N D
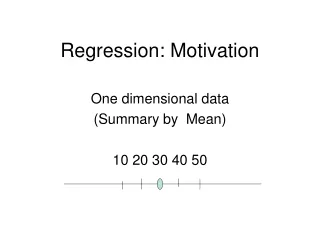
Regression: Motivation One dimensional data (Summary by Mean) 10 20 30 40 50
X(X-a)2 10 (10-a)2 20 (20-a)2 30 (30-a)2 40 (40-a)2 50 (50-a)2 150 T min T when a = mean=30
Regression • Concerns • Data summarization • (As in one dimensional data) • Prediction of low birthweight baby • (for special prenatal care to those in high risk)
Scatter plot Birth weight Estriol
Regression line: The best lineThe best representation of data
What is this with a line and numbers anyway? • They could be the same in two different form or language • But, lines require less space to record remember, memorize and are easy to comprehend • Lines could be pictorial or mathematical representation of numerical data
A line Y = 2+3X Numbers generated by the line Slope = 2 Intercept =3 (interpretation ??)
Representation of bivariate measure ments in different forms • Equation Y =2+3x • Data/Number • x y • 0 2 • 1 5 • 2 8 • … … 50 152 • … … • … … Picture/Graph
Regression: what line will generate the data? Birth weight Estriol
Regression The Saga continues
Out of curiosity How did this accomplish what we wanted (i.e. data summarization and identifying women who might need special prenatal care)
1. We end up with the line Birthweight =21.52+0.608 Estriol, hoping that this line will generate the original data 2. In the case of univariate ‘mean’ is closest to the data in a sense. In similar way, regression line is the closet line to the data . In that sense it summarizes the data.
Recall One dimensional data (Summary by Mean) 10 20 30 40 50
Recall X(X-a)2Bweight (bweight- L)2 10 (10-a)2 25 (25-L)2 20 (20-a)2 25 (25-L)2 30 (30-a)2 25 (25-L)2 40 (40-a)2 27 (27-L)2 50 (50-a)2 … … Mean=30 minimizes sumL =21.52+0.608 Esriol minimizes the sum – This is regression line
Prediction • Women that need special care • If lowbirth weight is defined as < 2500g, then women with estriol level < 5.72 are in hirisk of having low birthweight babies.
So is everything fine and dandy • Not necessarily - • How closely does the regression line generates the data? • How much is estriol is responsible for birthweight?? • Was there something that would have better predicted women at risk???
How good is the regression • R2 = 0.372 • Estriol explains about 37.2% of variation in the birthweights. Remaining 62.8 % is explained by other factors • At estriol 16, we have several birthweight s(24,30,31,32 and 35). If estriol is the only factor for Birthweight we would not see this variation.
Other factors Multiple Regression
Regression Diagnostics Residual Analysis
Diagnostics • Residual for a patient (observation) • Difference between observed birthweight and the birthweight regression line would generate (predict) • Example: (for the first patient) • Observed birthweight = 25 • Generated = 21.52+0.608 estriol =21.52+0.608(7)=25.776 Residual = 25-25.776= -0.776
Diagnostics • Residual plots • Plot of residuals against predicted values • For assumptions • Normality, linearity and homoscedasticity
Non normal nonlinearity Heteroscedasticity
Diagnostics • Residuals for influence patients (observation) - change in estimated parameters (slope and intercept) when the analysis is redone without the patient in question Patients with high leverage and large residual will have greater influence.
Diagnostics • Standardized and the studentized (or jackknife) residual • A patient with large values for these residuals indicate outliers