Download
1 / 19
200 likes | 354 Views
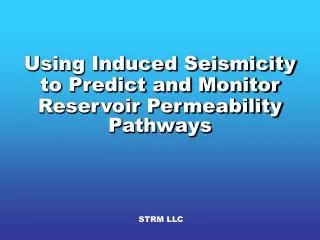
STRM LLC. Using Induced Seismicity to Predict and Monitor Reservoir Permeability Pathways. Sh max. Flood Directionalities > 40 Fields. Positive Rate Correlations for Field Study A. Rate Correlation Statistics (Heffer et al., 1997).

E N D
STRM LLC Using Induced Seismicity to Predict and MonitorReservoir Permeability Pathways
Shmax Flood Directionalities > 40 Fields Positive Rate Correlations for Field Study A Rate Correlation Statistics (Heffer et al., 1997) Critical Observations on the Behavior of Fluid Systems in the Earth’s Crust
Shmax • 5 kms None or negative change in production Shmax Production increase Positive correlations have “zero lag time” at all distances. Rate Correlation Statistics (Heffer et al., 1997) Critical Observations on the Behavior of Fluid Systems in the Earth’s Crust Injection well
Critical Observations on the Behavior of Fluid Systems in the Earth’s Crust
Critical Observations on the Behavior of Fluid Systems in the Earth’s Crust
Critical Observations on the Behavior of Fluid Systems in the Earth’s Crust • Hydraulically conductive fractures form the permeability system and are critically stressed according to Mohr-Coulomb behavior. • Hydraulically conductive fractures show a conoidal distribution with respect to Shmax . • Critically stressed fractures containing fluid are the weakest part of the naturally occurring fracture system andwill respond first to a change in stress state.
Critical Observations on the Behavior of Fluid Systems in the Earth’s Crust • Micro-seismicity and creep created by a change in stress state will occur dominantly and in many cases exclusively on fractures forming the permeability system. 12
The STRM Model 1) D Pf in a well D stress state about well. 2) D stress state failure of the medium on critically oriented cracks seismicity. 3) Permeable cracks = critically oriented cracks. 4) Seismicity induced by DPf = permeable crack system = Permeability (P) seismicity. Observation: The state of stress in earth’s brittle crust is everywhere near failure.
STRM Hypothesis P Seismicity Signature Spatial: Given a mechanically isotropic medium with an isotropic crack distribution. • Should occupy opposing conoidal volumes. • Cone axis should = Shmax of ambient stress field. • Apical angles should range from 60o - 90o. • Seismicity should extend for kms from injection point. Temporal • Seismicity should propagate from injection point at rates km/month.
Test of Hypothesis Data from Rangely Field Experiment, Colorado • Observations: Monitoring microseismicity and fluid pressure during a water flood. • Rapid response at distance: Earthquake activity up to > 4 km from injectors ceases within 1 day of shut in. • Increase in Pf Increase in earthquake activity. • Spatial and temporal characteristics of microseismicity consistent with STRM hypothesis.
Injection Withdrawal Injection Injection Wells 1 Km 10/69 - 10/70 11/70 - 7/71 8/71 - 10/71 Fluid Pressure Isobars 70 Injection Injection Shut in N 140 210 255 280 Seismicity Shmax 11/71 - 8/72 9/72 - 5/73 6/73 - 5/74 Eq Magnitude -0.5 Pattern of Seismicity (Map View) Data from Rangely Field Experiment, Colorado Raleigh et al, 1976
s1 s1 Seismicity Boundary s1 s1 Pattern of Seismicity (Section View) Data from Rangely Field Experiment, Colorado Raleigh et al, 1976
Passive Seismic Emission Tomography PSET Earthquake Seismology Seismic Structure Tomography SST Brittle Failure Processes of the Earths Crust • Macro-Seismicity, Micro-seismicity and Creep Approximate Rupture size - meters 10-6 10-5 10-4 10-3 10-2 10-1 100 101 102 103 Micro-Seismicity Macro-Seismicity Creep Imaging Method Earthquake Magnitude
Passive Seismic Emission Tomography (PSET™) t1 Micro-Array t2 t3 Sti Given: Velocity Model
Passive Seismic Emission Tomography (PSET™) Slice through PSET cube. Hot colors = emax
Failure processes in the brittle (seismogenic) crust – the role of fracturing in creep. Brittle Failure Processes of the Earths Crust Clast scale Deformation Grain scale Deformation Bed scale Deformation
Heterogeneity of Brittle Failure Processes of the Earths Crust Valley and Ridge: Virginia 2 Km
Heterogeneity of Brittle Failure Processes of the Earths Crust Bear Valley: Pa.
Heterogeneity of Brittle Failure Processes of the Earths Crust North West Territory: Canada 1 Km