Download

1 / 31
460 likes | 1.48k Views
Non-Hodgkin’s Lymphoma. Epidemiology, Disease and Staging. Haematopoietic Malignancies. Malignant lymphomas. Myeloproliferative diseases. Leukaemias. chronic myeloid leukaemia (CML). Acute myeloid leukaemia (AML). Hodgkin’s lymphoma. Non-hodgkin’s lymphoma (NHL). Polycythemia vera (PV).

E N D
Non-Hodgkin’s Lymphoma Epidemiology, Disease and Staging
Haematopoietic Malignancies Malignant lymphomas Myeloproliferativediseases Leukaemias chronic myeloid leukaemia(CML) Acute myeloidleukaemia(AML) Hodgkin’slymphoma Non-hodgkin’slymphoma(NHL) Polycythemiavera(PV) Chronic myeloidleukaemia(CML) Idiopathic myelofibrosis(MF) Acute lymphaticleukaemia(ALL) Burkitt's lymphoma cutaneous T-celllymphoma (CTCL) Essentialthrombocythemia(ET) Chronic lymphaticleukaemia(CLL) hairy cellleukaemia(HCL)
Haematopoietic Malignancies Malignantlymphomas Myeloproliferativediseases Leukaemias • Family of chronic neoplastic diseases • Due to a clonal disorder arising at the level of the pluripotent stem cell • Characterised by abnormal proliferation of 1 or more blood cell lines • Neoplastic disease of a haematopoietic precursor cell • Characterised by replacement of normal bone marrow • Often infiltration into other organs • Malignant clones suppress normal cell formation • Neoplastic disease of lymphatic tissue • Originates in lymph node or spleen • Hodgkin’s (15%) • non-Hodgkin’s (85%)
Lymphatic Tissue • Lymph nodes, spleen, liver, skin and the respiratory, GI and GTU tract • Lymphocytes undergo further proliferation and differentiation in lymphoid tissue • B-lymphocytes • tend to reside in lymph nodes & spleen • T-lymphocytes • tend to circulate throughout the lymphatic system
Lymph Node - normal histology afferent lymphatic vessel capsule C cortex follicle (mainly B-cells)- germinal centre- mantle zone paracortex medulla artery efferent lymphatic vessel vein
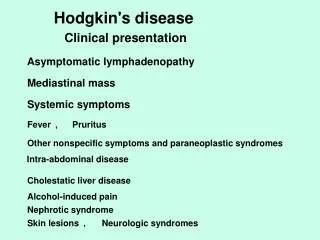
Hodgkin’s Lymphoma • 15% of lymphomas • First described by Thomas Hodgkin in 1832 • Originally had a very poor prognosis(<10% survival at 5 years) • Improved staging techniques and understanding of the pattern of spread helps direct management • Now curable in over 70% of cases through the use of radiotherapy and chemotherapy
Non-Hodgkin’s Lymphoma (NHL):Definition and Indication A heterogeneous group of B- and T-cell malignancies that are diverse in cellular origin, morphology, cytogenetic abnormalities, response to treatment, and prognosis
Non-Hodgkin’s Lymphoma (NHL) • 85% of lymphomas • 6th major cause of cancer deaths yearly Heterogeneous group of malignant diseases arising from lymphoid tissue • lymph nodes, spleen • Various immune cell types • principally B-cells derivation (>85%) • T-cells derivation • Histiocytes (very rarely) • Various stages of differentiation and maturation
NHL Incidence • Incidence of 13.3/100,000 per year (Aust) • Predominates in the 40-70 years age group • most common neoplasm in the 20-40 age group • Incidence is rising • 150% growth over the past 30 years • increasing by 4% annually since 1970’s • Mortality rate is also rising • 2% rise per year • third highest rise, exceeded only by lung cancer in women and malignant melanoma
NHL Incidence • Increases with age • implications • Slight male predominance overall • Striking male predominance for several subtypes • Incidence of certain subtypes varies greatly around the world • Burkitt’s Lymphoma in African children • T-cell type more common in Japan
Estimated Incidence of NHL in the Year 2000 (Worldwide) North America South Central Asia Eastern Europe Southeast Asia Northern Europe Western Africa Northern Africa Australia/New Zealand Caribbean Melanesia Micronesia 0 10,000 20,000 30,000 40,000 50,000 60,000
Estimated Incidence of NHL (US) 60,000 45,000 Estimated Annual Incidence 30,000 ~4% compound annual increase in incidence 15,000 0 1980 1985 1990 1995 2000 Year Adapted from Greenlee et al. CA Cancer J Clin. 2001;51:15.
Revised European-American Lymphoma (REAL) Classification:B-Cell Neoplasms Hiddemann. Blood. 1996;88:4085.
Precursor B-cell neoplasm Precursor B-lymphoblastic leukemia/lymphoma (precursor B-cell acute lymphoblastic leukemia) Mature (peripheral) B-cell neoplasms B-cell CLL/SLL B-cell PLL Lymphoplasmacytic lymphoma Plasmacytoma, plasma cell myeloma HCL Marginal zone B-cell lymphoma Marginal zone B-cell lymphoma of MALT Nodal marginal zone lymphoma(+/- monocytoid B-cells) Splenic marginal zone B-cell lymphoma FL Grade 1, 0-5 centroblasts/hpf Grade 2, 6-15 centroblasts/hpf Grade 3, >15 centroblasts/hpf 3a, >15 centroblasts, but centrocytes still present 3b, centroblasts from solid sheets with no residual centrocytes Variants Cutaneous follicle center MCL DLCL Mediastinal (thymic) large B-cell lymphoma Intravascular lymphoma Primary effusion lymphoma Burkitt’s lymphoma/Burkitt cell leukemia World Health Organization (WHO) Classification of Lymphoid Neoplasms:B-Cell Neoplasms Jaffe et al. Ann Oncol. 1998;9 (suppl 5):S25.
Modified Ann Arbor Staging of NHL Stage I Involvement of a single lymph node region Stage II Involvement of 2 lymph node regions on the same side of the diaphragm Stage III Involvement of lymph node regions on both sides of the diaphragm Stage IV Multifocal involvement of 1 extralymphatic sites ± associated lymph nodes or isolated extralymphatic organ involvement with distant nodal involvement The Non-Hodgkin’s Lymphoma Pathologic Classification Project. Cancer. 1982;49:2112.
Follicular non-Hodgkin’s Lymphoma Classification and survival
Classification of Indolent NHL:International Working Formulation (IWF) A. Small lymphocytic 3.6 5.8 B. Follicular, predominantlysmall cleaved cell 22.5 7.2 C. Follicular, mixed small and large cell 7.7 5.1 D. Follicular, predominantly large cell 3.8 3.0 % of NHL Median Class Patients Survival (y) The Non-Hodgkin’s Lymphoma Pathologic Classification Project. Cancer. 1982;49:2112.
Survival of Patients with Indolent Lymphoma:The Stanford Experience, 1960-1996 1987-1996 1976-1986 1960-1975 100 80 60 Patients (%) 40 20 0 5 10 15 20 25 30 0 Year Adapted from Horning. Semin Oncol. 1993;20(5 suppl 5):75.
SWOG Finding: New treatment options have changed the natural history of follicular lymphoma1 91% 79% 69% Overall survival (%) Adapted from ref 1 1974-1978CHOP +non-specificimmunostimulants 1998-2000CHOP + monoclonalantibody therapy 1988-1994ProMACE – MOPP+Interferon Impact of new treatment options on the natural history of follicular lymphoma determined by SWOG via retrospective analysis of three sequential treatment approaches. 1:Fisher et al Blood 2004;104 Abstract 583
Follicular Lymphoma: Overall Survival 100 80 IPI 0/1 60 Overall Survival (%) IPI 2/3 40 20 IPI 4/5 P<0.001 0 0 1 2 3 4 5 6 7 8 Year Adapted from Armitage and Weisenburger. J Clin Oncol. 1998;16:2780.
Aggressive non-Hodgkin’s Lymphoma Classification and Survival
National High-Priority Lymphoma Study: Overall survival for aggressive lymphoma 100 CHOP m-BACOD ProMACE-CytaBOM 80 MACOP-B 60 Patients (%) 40 20 0 0 1 2 3 4 5 6 Years After Radomization Fisher et al. N Engl J Med. 1993;328:1002.
International Prognostic Index (IPI) Patients of all ages Risk Factors Age >60 years PS 2-4 LDH levelElevated Extranodal involvement>1 site Stage (Ann Arbor)III-IV Patients 60 years (age-adjusted)PS 2-4 LDHElevated StageIII-IV Shipp. N Engl J Med. 1993;329:987.
IPI Risk Strata All ages Low (L) 0-1 Low-intermediate (LI) 2 High-intermediate (HI) 3 High (H) 4-5 Age-adjusted L 0 LI 1 HI 2 H 3 Risk Factors Risk Group Shipp. Blood. 1994;83:1165.
IPI: Overall Survival by Risk Strata 100 75 L 50 Patients (%) LI HI 25 H 0 0 2 4 6 8 10 Year Adapted from Shipp. N Engl J Med. 1993;329:987.
Age-Adjusted IPI: Overall Survival by Risk Strata 100 L 75 LI 50 Patients (%) HI H 25 0 0 2 4 6 8 10 Year Adapted from Shipp. N Engl J Med. 1993;329:987.
DLCL: Overall Survival 100 80 IPI 0-1 60 Patients (%) 40 IPI 2-3 IPI 4-5 20 P<0.001 0 0 1 2 3 4 5 6 7 8 Year Adapted from Armitage and Weisenburger. J Clin Oncol. 1998;16:2780.