Download

1 / 33
330 likes | 405 Views
Using the Normal pdf. Approximations to Several Distributions. Approximating Distributions. The normal has been found to be a useful distribution in approximation other distributions.

E N D
Using the Normal pdf Approximations to Several Distributions
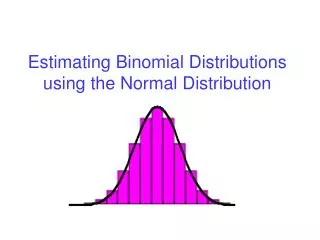
Approximating Distributions • The normal has been found to be a useful distribution in approximation other distributions. • Although it is a continuous distribution, it can also be used to approximate discrete distributions, specifically the binomial and the Poisson.
Approximating the Binomial • As n becomes large, calculating binomial probabilities can become time consuming. • The normal distribution is useful in approximating binomial probabilities. • The larger the binomial parameter n, the more accurate the approximation.
Mean and Variance(from Binomial to Normal) • If the normal is to approximate a binomial, it seems reasonable that the mean and variance of the normal should be the same as the mean and variance of the binomial that is being approximated. • Specifically, let m = np and s2 = np(1-p).
Example 10, N(10,5) To approximate a binomial with n = 20 and p = 0.5 would require a normal distribution with • m = (20)(0.5) = 10, • s2 = (20)(0.5)(1-0.5) = 5, and • s = = 2.236.
Example 10 - Shape • In this instance, the shapes of the distribution are quite similar, and consequently the approximation will be good.
Good Approximations? two tests on np and nq • Generally, the approximation is reasonable when the mean of the binomial, np, is greater than or equal to 5 and n(1-p) is greater than or equal to 5. • The approximation becomes quite good when np is greater than or equal to 10 and n(1-p) is greater than or equal to 10.
Example 11 • Suppose that 2,000 subjects are asked to select whether Pepsi or Coke tastes better. • If it is assumed that there is no difference in product preference, what is the probability of observing 900 or less subjects who thought Coke was superior?
Example 11 - Solution • Let X = number of subjects that selected Coke as superior. • The actual distribution of X is binomial (n = 2000, p = .5), but the desired probability is too difficult to calculate directly.
Example 11 - Solution • The expected value of X is • m = E(X) = np • = (2000)(.5) = 1000. • The variance of X is • s2 = V(X) = np(1 - p ) • = (2000)(.5)(1 - .5) = 500. • The standard deviation is • s = sqrt(500)= 22.36.
Example 11 - Solution • Let Y be a normally distributed random variable with a mean of 1,000 and standard deviation of 22.36, then • =
Example 11 - Solution The probability is so small (about 4 in one million), observing 900 or less persons who prefer Coke is almost certain not to occur if the assumption of no preference is true. [Similarly for <900.5]
Continuity Correction • The normal approximation to the binomial can be improved by using a continuity correction. • Example 12 • Suppose that you wished to determine the probability that a binomial random variable (n = 20, p = .5) is equal to 5.
Example 12 • To approximate the probability using the normal would be equivalent to approximating the area of the shaded rectangle in the figure. • To approximate the area of the rectangle using the normal would require finding the area under the curve between 4.5 and 5.5.
Example 12 • Similarly, to use the normal to approximate the probability that a binomial random variable was 5 or less implies finding the area of the rectangles for 0, 1, 2, 3, 4, and 5.
Example 12 • Instead of using the normal approximation P(X 5), use the continuity correction P(X 5.5) in order to accumulate all of the probabilities under the normal curve that corresponds to the rectangle associated with the point 5.
Example 12 • If the problem were to find the probability that the binomial random variable were greater than 4, then the continuity correction for the normal approximation would be P(X 4.5).
Example 13 • A supplier of diskettes has recently raised its prices. • A company which purchases large quantities of diskettes has decided to look for other suppliers. • One of the critical concerns in the purchase of diskettes is the fraction that will not format properly.
Example 13 • Disks that will not format will be rejected by duplicating equipment. • A potential supplier claims that only 1 percent of their disks will not format. • Assume that the supplier's claim is correct.
Example 13 • If a sample of 1000 diskettes are purchased, what are the answers to the questions that follow. • Let X = the number of diskettes which will not format in a sample of 1000. • X has a binomial distribution with n = 1000 and p = .01.
Example 13 - A What is the expected number of diskettes in the sample that will not format? m = np = (1000)(.01) = 10
Example 13 - B What is the standard deviation of the number of diskettes in the sample that will not format? s = Note: Since np and n(1-p) are both 5, X has an approximately normal distribution with m = np = (1000)(.01) = 10 and s = . Since np =10 10, use continuity correction.
Ex13 – C, x=16,17,… are included What is the probability that more than 15 of the diskettes in the sample will not format? [pillar for 16 begins at 15.5] P(X > 15) P(X > 15.5) =P = P(z > 1.75) = .5 - P(0 < z < 1.75) =.5 - .4599 = .0401
Ex13 – D, x=21,22,… are included What is the probability that more than 20 of the diskettes in the sample will not format? P(X > 20) P(X > 20.5) =P{[(x-)/ ]>[(20.5-20)/3.1464] } = P(z > 3.34) = .5 - .4996 = .0004
Example 13 - E Suppose you observed 22 diskettes fail. Would you believe that suppliers claim? Give reasons for your conclusions. No. Because from part D, we know that if p = .01, P(X > 20) = .0004. i.e. If p = .01, it is very unlikely (.04% chance) that the number of defective diskettes is greater than 20.
Approximating the Poisson by the Normal • To use the normal approximation, the mean and variance of the normal should be set to the mean and variance of the Poisson. • Since the mean and variance of the Poisson are both l, the appropriate mean, variance, and standard deviation for the normal would be m = l, s2 = l, s = .
Example 14 A company manufacturing metal sheets believes that the number of defects on a 10’ by 10’ sheet of metal follows a Poisson distribution with an average defect rate of 5 per sheet. Metal Inc.
Example 14 - A Find the standard deviation of the number of defects per sheet.
No Continuity Correction if l 5. • Let X = the number of defects on a 10' by 10' sheet of metal. • X has a Poisson distribution with a mean of 5 and standard deviation of 2.236. • X also has an approximately normal distribution with mean of 5 and standard deviation of 2.236. • No continuity correction is necessary because l = 5 5.
Compute the exact prob. (Poisson Tables) Using the Poisson table in the appendix, find the exact probability of observing at least 10 defects per sheet. P(X 0) = P(X=10) + P(X=11) + P(X=12) + P(X=13) + P(X=14) + P(X=15) + ... = .0181 + .0082 + .0034 + .0013 + .0005 + .0002 + 0 = .0317
Compute Normal Approx to Poissson Using the normal approximation to the binomial, find the probability of observing at least 10 defects per sheet. P(X 10) = P = P(z 2.24) = .5 - P(0 < z < 2.24) = .5 - .4875 = .0125
Normal Approx underestimates prob. How do the answers in parts B and C compare? The difference is .0125 - .0317 = -.0192. i.e. The normal approximation underestimated the actual probability by .02.
How Stats Learning can Help in Life • Problem Solving skills • Attention to Detail and focusing on the problem • Clear Statement of the Problem (avoiding fuzzy) • Delineation of the steps in solving problems and the patience in implementing them.