Download
1 / 38
380 likes | 506 Views
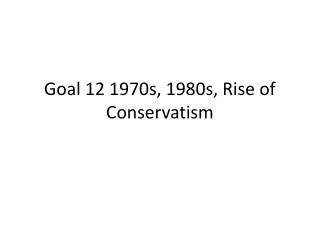
September, 1962. Did Banning DDT Devastate Cotton Farmers in the mid-1970s?. protects. DDT kills Boll Weevils. & Bald Eagles. EPA banned DDT beginning in 1973. Market for Cotton, 72-74. P Cotton. Q Cotton . S 74. Banning DDT caused a derease in supply. S 72. P 74. P 72. D 72. Q 74.

E N D
September, 1962 Did Banning DDT Devastate Cotton Farmers in the mid-1970s? protects DDT kills Boll Weevils & Bald Eagles EPA banned DDT beginning in 1973
Market for Cotton, 72-74 PCotton QCotton S74 Banning DDT caused a derease in supply S72 P74 P72 D72 Q74 Q72
Political Scientist Aaron Wildavsky argues: DDT Ban “cotton crash” “Devastated” cotton farmers
Two Effects of DDT Ban on Farmers’ Income: 1. Income by Q 2. Income by P Net Effect Depends on the Price Elasticity of Demand (ed)
Price Elasticity of Demand, ed ed measures the responsiveness of the quantity (of cotton) demanded to a change in cotton’s (own) price, ceteris paribus. ed =
Computing edusing the “Arc Formula” ed = = _____________________ Elasticity is dimensionless (units cancel out).
Calculating theedof Cotton New point Price ($ / lb) .43 Pavg =.34 ∆P = .16 Original point .27 ∆Q = −1.04 D Quantity (billions of lbs per year) 5.54 6.58 Qavg = 6.06
Price ($ / lb) .43 .27 D Quantity (billions of lbs per year) 5.54 6.58 Calculating ed ed = 17 % in Q Pavg =.34 ∆P = .16 = = causes = − 0.36 47 % in P ∆Q = −1.04 Qavg = 6.06
Calculating ed • Note that ed is always negative (or zero) because of the law of demand. • However, when discussing the value of ed , economists almost always use the absolute value. Using | ed |, a larger value means greater elasticity.
∞ 0 1 Definitions—Inelastic & Elastic perfectly elastic | ed | = ∞ perfectly inelastic | ed | = 0 elastic inelastic 0 < | ed | < 1 | ed | > 1
Price ($ / lb) 74 P74=0.43 72 P72=0.27 D Quantity (billions of lbs per year) 5.54 6.58 Q74Q72 ed and Total Revenue (TR) TR72=$0.27 per lb *6.58 bil. lbs = $1.78 billion = B + C TR74 = $2.38 billion = A + B = $0.60 billion ∆TR = A − C A = $600 million | ed | = .36 D is inelastic B C if | ed| < 1 then↑ P ↑ TR
∞ 0 1 ed& Total Revenue 0 < | ed | < 1 | ed | > 1 Demand is … inelastic elastic TR TR P causes…
“The economics of coal revolved around two factors: most of the cost of production was wages for miners, and if the supply fell the price would shoot up because in an age before oil and electricity, there were no good substitutes. Profits were low in 1902 because of an over supply; therefore the owners welcomed a moderately long strike. They had huge stockpiles which grew in value daily. It was illegal for the owners to conspire to shut down production, but not so if the miners went on strike. The owners welcomed the strike, but they adamantly refused to recognize the union, for then it would control the coal industry.” http://en.wikipedia.org/wiki/Coal_Strike_of_1902
What is edfor Cigarettes? %∆Qd -4 %∆Pcig 10 • “Economic studies have suggested that a price increase of 10 percent reduces smoking about 4 percent” • ed = = −0.40 = Hence, studies Demand for cig is inelastic
Premium Cig (PC) and Discount Cig (DC) In 1998, PPC↑ from $2.45 to $2.90 per pack while the PDC = $1.50. Analysts predicted 10% ↓ in Q of PC demanded. PC What is the analyst’s estimate of ed ? ed PC = = = = −0.60 Why |ed PC| = 0.60 > |ed Cig|= 0.40?
Determinants Of Elasticity 1. Number of Substitutes Example: Demand for premium cigs Demand will be more elastic as the number of substitutes increases | eCamels||ePC||eAll Cigs| > >
Market for At-Need Epidural Blocks (EB) Very Nearly perfectly inelastic PEB D QEB Determinants of Elasticity 2. Necessities versus Luxuries Demand for necessities tend to be inelastic
Gardasil: vaccine (for pre-teen girls) against (HPV) virus that causes cervical cancer. The price charged by Merck & Co. is $360. (Wikipedia)
“Anti-Cancer Vaccine A Tough Sell To Parents” National Public Radio, Thursday, September 18, 2008 “As of late 2007, just one in five American girls under the age of 18 had received shots for HPV.” Reasons for Low %: 1) Parents doubt that their child is sexually active. 2) Mistrust of vaccines 3) Price…“cost is a major obstacle if the girl is not covered by insurance”
Determinants Of Elasticity 3. Proportion of the Budget | eGardasil ||eGardasil | > Poor HHs Non-Poor HHs Goods that are a small % of peoples’ budgets tend to have inelastic demands (e.g., salt) 4. Time Frame | eReal Skeletons||eReal Skeletons | > Long-Run Short-Run India banned skeleton exports in 85
250GBHard Drives Western Digital (WD) Seagate Internal External “My Book” “FreeAgent”
WD’s External Drive WD’s Internal Drive P P $100 $75 Q Q Q1 Q1 The Demand for WD Drives Less than perfectly elastic Nearly… Perfectly Elastic D D
Snow Storms Hit EastCoast in Jan 05 January 27, 2005 1-month snowfall a 113-year high INELASTIC e = = 0.62
Supply Elasticity of … Market for Road Salt, 2004-2005 PRS S04 =S05 ($ per ton) $46 P05 $32 P04 D05 D04 QRS Q04 Q05 (millions tons / yr) 16 20
Elasticity of Supply Market for Road Salt, 2004-2005 PRS S04 =S05 ($ per ton) $46 P05 $32 P04 QRS Q04 Q05 (millions tons / yr) 16 20
Income Elasticity of Demand, ey %∆D ___________________ %∆Y • If ey> 0, then good is a normal good. • If ey < 0, then good is an inferior good. ey =
↑ Income ↑ Garbage Collection? Garage Collected (lbs per capita) 2000 1960 Average Family Income (thousands of real $)
Income Elasticity of Demand for Garbage Collection = ≈ ____________________ = = 0.84
Income Elasticity of Demand, ey Our estimate, ey= From Fullerton & Kinnaman (2000), ey= Garbage removal is a normal good.
PGC QGC(lbs per capita) Income Elasticity of Demand, ey Last Severe Recession (early 80s) %∆Y= -9% S Predicted ∆ Demand if same ∆ Income Occurs Today using F&K’s ey Substituting, P2007 D2007 Solving, D2009 1800
%∆DX %∆PZ Cross-Price Elasticity of D, ex,z ex,z measures ∆ demand for a good caused by a ∆ price of another good, ceteris paribus. ex,z= eX,Z> 0 X & Z are substitutes (e.g., heroin and marijuana) eX,Z < 0 X & Z are complements (e.g, graves and caskets are complements
%∆DH %∆PM Not Surprising… to an Economist Suppose eHeroin,Marijuana > 0 In 1969, US Army launched “an all-out campaign” against marijuana suppliers in Vietnam. In 1972, thousands of US soldiers were using heroin daily. PM DH
Market for HPV Vaccine, 2010 Price ($ per vaccine) D If doctor rec HPV Vaccine Current Situation A B If doctor rec HPV Vaccine Sample of 14-17 year old girls Zero price & C 1872 2485 3074 Quantity Source: National Health Interview Survey, 2010
Market for HPV Vaccine, 2010 Price ($ per vaccine) If doctor rec HPV Vaccine Current Situation A B If doctor rec HPV Vaccine Sample of 14-17 year old girls Zero price & C 1872 2485 3074 Quantity Source: National Health Interview Survey, 2010