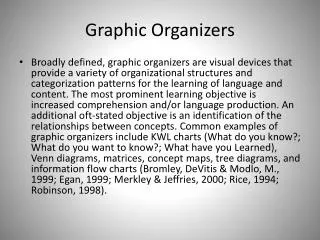
Graphic Organizers
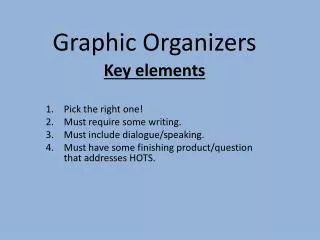
Graphic Organizers. Graphic Organizers at the Beginning and the End of a Lesson. K W L H.

Graphic Organizers
E N D
Presentation Transcript
K W L H The K-W-L-H teaching technique is a good method to help students activate prior knowledge. It is a group instruction activity developed by Donna Ogle (1986) that serves as a model for active thinking during reading. K - Stands for helping students recall what they KNOW about the subject. W - Stands for helping students determine what they WANT to learn. L - Stands for helping students identify what they LEARN as they read. H - Stands for HOW we can learn more (other sources where additional information on the topic can be found).
Anticipation/Reaction Guides An Anticipation/Reaction Guide is used to assess a class's knowledge before they begin a lesson.
Prior Knowledge Topic Survey • Anticipation/Reaction Guide • Instruction: Respond to each statement twice: once before the lesson and again after reading it. • Write A if you agree with the statement • Write B if you disagree with the statement
Spider Map Used to describe a central idea: a thing (a geographic region), process (meiosis), concept (altruism), or proposition with support (experimental drugs should be available to AIDS victims). Key frame questions: What is the central idea? What are its attributes? What are its functions?
Series of Events Chain Used to describe the stages of something (the life cycle of a primate); the steps in a linear procedure (how to neutralize an acid); a sequence of events (how feudalism led to the formation of nation states); or the goals, actions, and outcomes of a historical figure or character in a novel (the rise and fall of Napoleon). Key frame questions: What is the object, procedure, or initiating event? What are the stages or steps? How do they lead to one another? What is the final outcome?
Continuum Scale Used for time lines showing historical events or ages (grade levels in school), degrees of something (weight), shades of meaning (Likert scales), or ratings scales (achievement in school). Key frame questions: What is being scaled? What are the end points?
Comparison/Contrast Matrix Used to show similarities and differences between two things (people, places, events, ideas, etc.). Key frame question: What things are being compared? How are they similar? How are they different?
Problems-Solutions Outline Used to represent a problem, attempted solutions, and results (the national debt). Key frame questions: What was the problem? Who had the problem? Why was it a problem? What attempts were made to solve the problem? Did those attempts succeed?
Network Tree Used to show causal information (causes of poverty), a hierarchy (types of insects), or branching procedures (the circulatory system). Key frame questions: What is the superordinate category? What are the subordinate categories? How are they related? How many levels are there?
Human Interaction Used to show the nature of an interaction between persons or groups (Europeans settlers and American Indians). Key frame questions: Who are the persons or groups? What were their goals? Did they conflict or cooperate? What was the outcome for each person or group?
Fishbone Map Fishbone Map Used to show the causal interaction of a complex event (an election, a nuclear explosion) or complex phenomenon (juvenile delinquency, learning disabilities). Key frame questions: What are the factors that cause X ? How do they interrelate? Are the factors that cause X the same as those that cause X to persist?
Cycle Used to show how a series of events interact to produce a set of results again and again (weather phenomena, cycles of achievement and failure, the life cycle). Key frame questions: What are the critical events in the cycle? How are they related? In what ways are they self-reinforcing?
Printable Graphic Organizers • http://edhelper.com/teachers/graphic_organizers.htm • This is free. • Try Yahoo or Google for a lot of printable graphics organizers, some free, some paid.